Table of Contents
- Introduction
This binary provides provides options to request and create displays for substreams on demand at runtime.
For an example how to extend the Qt5 Substream Display please have a look at Qt5 Substream JSON Display (BETA).
- Note
- Please note that this is the initial version of the Qt5 Substream Display which brings a new technology in ADTF that have still a BETA label. Feel free to use and send us your feedback ! Within the next deliveries we will finalize the the content.
Qt5 Substream Display (BETA)
- Plugin Information
Plugin Filename adtf_substream_qt_display.adtfplugin Plugin Description adtf_substream_qt_display.plugindescription Plugin Name Qt5 Substream Display Plugin (BETA) License ADTF Support Mail support@digitalwerk.net Homepage URL https://support.digitalwerk.net/
- Plugin Versions
Plugin Version 3.18.3 Plugin File Version 1.0 adtf 3.18.3 adtf::ucom 3.1.0
- Component Information
Name Qt5 Substream Display (BETA) CID qt_substream_display.ui_filter.adtf.cid Description Use this UI filter to request substreams and create displays for them on demand at runtime. Type Filter
- Properties
Name Value Type Description Subproperties layout_file cFilename Legacy: The name of the file forced to use for the displays layout. The Layout is automatically saved to the runtime settings of this filter! max_show_array_element_count 1024 tUInt64 The maximal count of array elements which are shown in substream treeview. processing_delay_treshold 500 tUInt32 The maximal accepted delay time between incoming data and last GUI processed data before incoming data thread is slowed down (milliseconds, 0 - switched off, 500ms - default) request_substreams_format 0 tUInt8 Format of substream requests. Value List:
plain = 0
prefix = 2
wildcard = 3
regex = 4request_substreams_from_file $(ADTF_SESSION_DIR)/$(ADTF_SESSION_FILE_NAME_NOEXT)_$(THIS_OBJECT_NAME)_request_substream.txt cFilename Line-separated file for substream requests. The input pin must be prefixed. request_substreams_from_string cString Semicolon-separated string for substream requests. The input pin must be prefixed. request_substreams_mode 1 tUInt8 Mode to interpret substream request list. Value List:
Use property request_substreams_from_file = 1
Use property request_substreams_from_string = 2save_requested_substreams_on_shutdown false tBool Whether the requested substreams shall be saved on shutdown. store_settings true tBool Whether the filter state shall be stored in settings. title cString Window title which will be used at runtime within Qt5 ADTF XSystem UI Service.
- Input Binding Objects
Name IID Proxy OID Description display_server substream_display_server.riddler.adtf.iid Interface server to provide access to display server factory qtshared_server qtshared.giant.ui.adtf.iid Interface server as qtshared interface to provide access to display server factory for QML
- Dynamic Pins
Dynamic Input Pins true Dynamic Output Pins false Dynamic Input Binding Pins false Dynamic Output Binding Pins false
- Required Interfaces
IID qt_xsystem.spider.services.adtf.iid
Qt5 Substream Display Selector (BETA)
- Plugin Information
Plugin Filename adtf_substream_qt_display.adtfplugin Plugin Description adtf_substream_qt_display.plugindescription Plugin Name Qt5 Substream Display Plugin (BETA) License ADTF Support Mail support@digitalwerk.net Homepage URL https://support.digitalwerk.net/
- Plugin Versions
Plugin Version 3.18.3 Plugin File Version 1.0 adtf 3.18.3 adtf::ucom 3.1.0
- Component Information
Name Qt5 Substream Display Selector (BETA) CID substreamdisplay_selector.streaming.adtf.cid Description Use this filter to select a substream given by the Qt5 Substream Display. Type Filter
- Properties
Name Value Type Description Subproperties name Substream Display Selector Name cString Name of the selector.
- Input Pins
Name Stream Type Description substreams adtf/substreams Input substream from which it is selected.
- Output Pins
Name Stream Type Description output qt5_substream_display_plugin__beta__substreamdisplay_selector_streaming_adtf_cid_output Provides a selected substream.
- Runner
Name Activation Type Data Triggered Data Input Thread Triggered Thread Cyclic Timer Triggered Timer Interval Description process_substreams 9 1 substreams 0 0 0 0 Default runner port for the input pin 'substreams'
- Output Binding Objects
Name IID Proxy OID Description display_server substream_display_server.riddler.adtf.iid display server object from Qt5 Substream Display.
- Dynamic Pins
Dynamic Input Pins false Dynamic Output Pins false Dynamic Input Binding Pins false Dynamic Output Binding Pins false
- Input Pin Stream Types
Pin Name substreams Meta Type Name adtf/substreams Stream Type Properties Name Value Type Description Subproperties substreams true tBool
Basic Usage
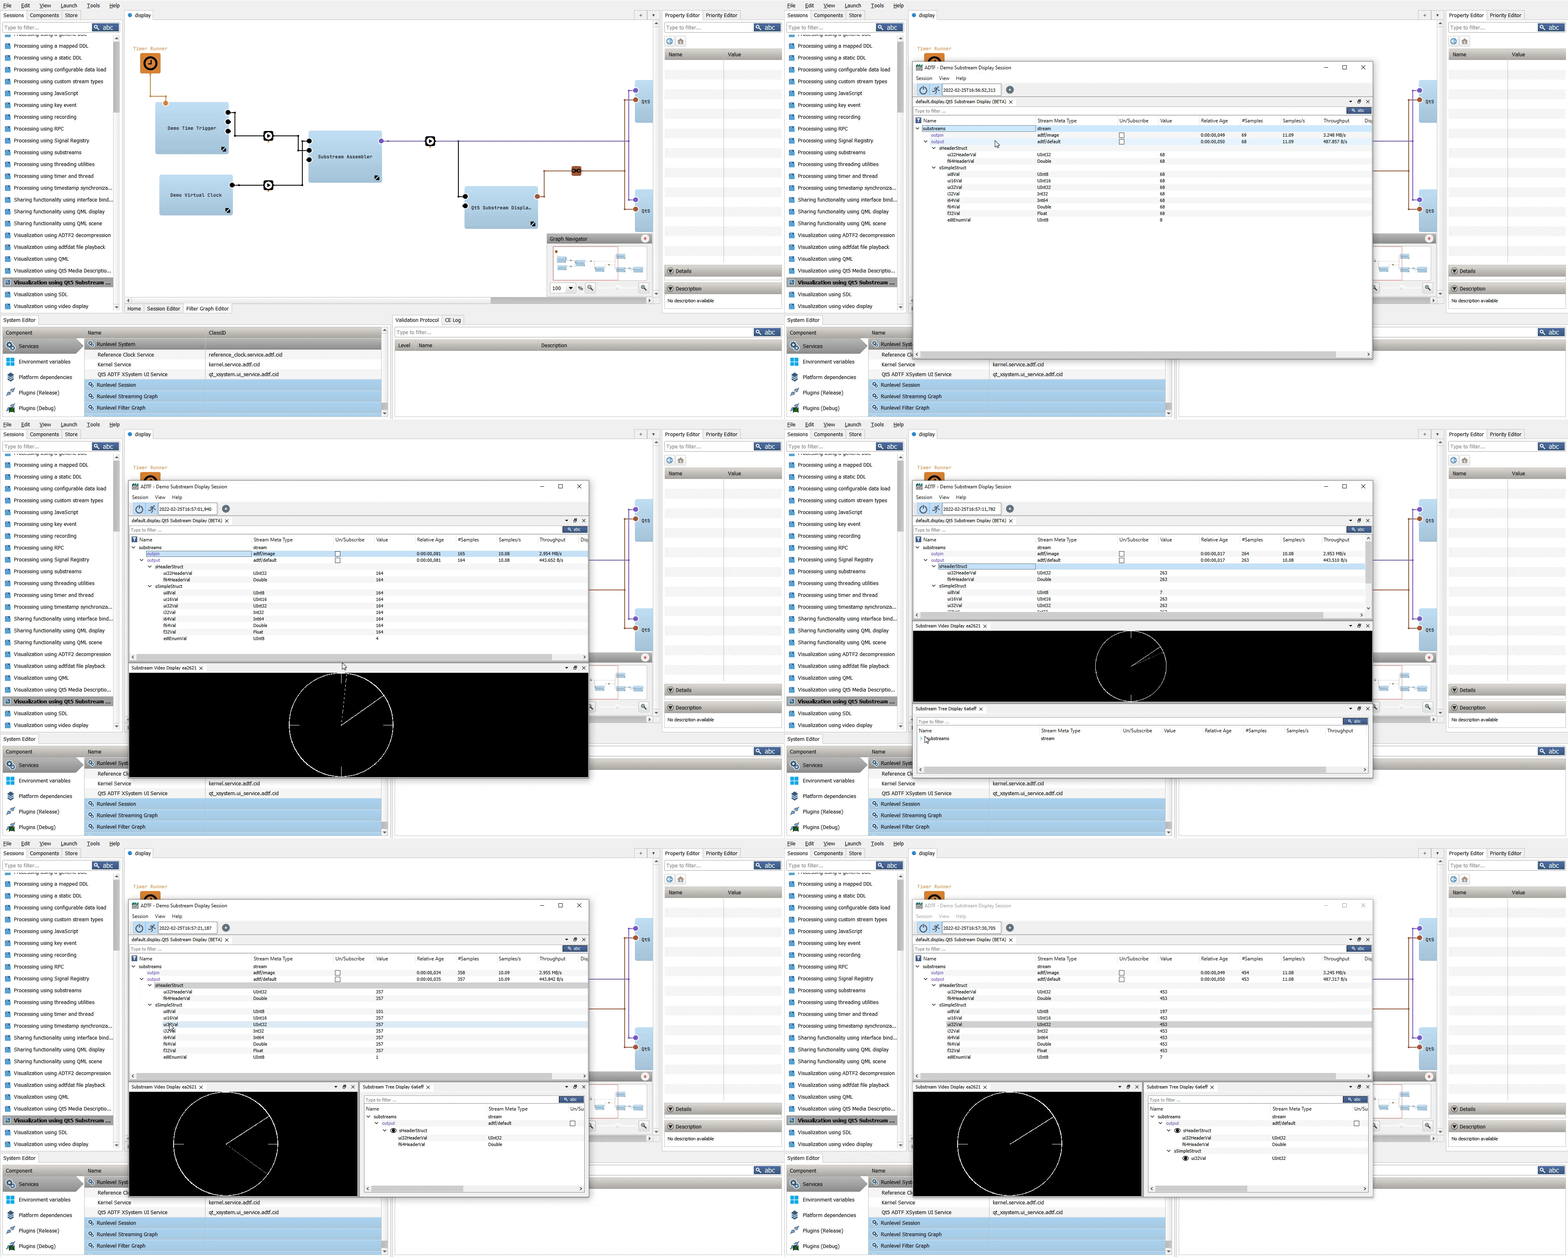
For a first usage, the example session Visualization using Qt5 Substream Display will show the basic functionality how to request displays on demand at runtime for substreams.
Furthermore, it offers a use case to request content for the recorder.

|
Line Graph Display
This description covers the Line Graph Display which is part of the Qt5 Substream Display plugin.
What the display can do
- Depicting multiple substream elements.
- Auto tracing substream elements.
- Zooming
- Depicting in various y modes
- Selecting a single sample or a range of samples for further operations.
- Exporting substream elements.
The display is split into to main views:
- Left: Overview of selected substream elements to plot.
- Right: The graph area to plot the data points over time.
Adding substream elements
You can add multiple substream elements to the display either via context menu entry or using drag and drop.
- Note
- Please note that currently only the drag and drop of single elementar substream elements is supported. (Drag and drop of substreams, structs, arrays as a block is not possible.)
Overview of selected substream elements
The left view gives an overview of selected substream elements including meta information of the added substream elements like name, minimum/maximum/average value. You can access several substream element administration functions via the context menu on the substream element view:
With the related checkbox of substream element you can set the visibility of the substream element.
- Context menu items
- Properties. Shows the properties dialog.
- Color. Change the color of the substream element graph.
- Line Style. Controls the line style of the graph.
- Scale. Causes the graph to be scaled in y direction. This is a relative value.
- Offset. Causes the graph to be moved in y direction. This value is in units of the quantity
- Min Value. Set the minimum value of substream element. This is significant for the case if the substream element meta information doesn't contain a minimum value.
- Max Value. Set the maximum value of substream element. This is significant for the case if the substream element meta information doesn't contain a maximum value.
- Plot Data Points. Causes the data points of the substream element to be drawn in the graph.
- Show Full substream element Names. Shows the full substream element names.
- Show Short substream element Names. Shows the short substream element names.
- Remove. Removes the substream element.
- Activate. Activates the selected substream elements so that they are visible.
- Deactivate. Deactivates the selected substream elements so that they are invisible.
- Show scales. Shows the scales of the selected substream elements.
- Hide scales. Hides the scales of the selected substream elements.
- Equalize to One Scale. Set the scaling of the selected substream elements to a common scaling. The graph is zoomed so that the common minimal and maximum values are visible.
- Properties. Shows the properties dialog.
Depicting multiple substream elements in different y modes
Multiple substream elements can be depicted in different y modes related to the y scale (axis).

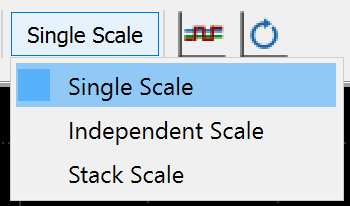
- Single scale. The y scales of the substream elements are united in a common scale.
- Independent scale. Each substream element has its own scale.
- Stack scale. Each substream element has its own view. The views are vertically stacked. The graphs are aligned related to the time scale.
The y mode is set via the y mode combobox.
Moving graph area
The graph area can be moved in x direction by holding the middle mouse button (or mouse wheel button) pressed and moving the mouse.
The substream element view has the modes of mouse control: zooming and selecting.
Zooming mode
The zoom direction can be set to horizontal (x/time), vertical (y) or to both variants. These works when
- button "Zoom-in"
or button "Zoom-out"
is pressed
- the zoom mode is switched on (toggle button
) and spanning by mouse (holding left button pressed) an area that is zoomed in.
- Note
- Due to technical circumstances, time values are currently only displayed accurately to a level of approximately 10 microseconds in the plot. In very large zoom levels, time values below this level are not displayed accurately.
The zoom direction is set via the respective toggle buttons "Zoom X Only" , "Zoom Y Only"
, "Zoom Both"
Selecting mode
You can select a single point or a range (=difference selection).
Based on this selection you can e.g. export substream element values.
The selection can be done horizontally/vertically respectively single point/range. The combination of horizontal/vertical and single/range is mapped by the toggle buttons "Single selection horizontal mode" , "Single selection vertical mode"
, "Difference selection horizontal mode"
, "Difference selection vertical mode"
. These buttons switch on the selecting mode.
Then you can
- set a point selection by clicking the left mouse button
- or select a range by clicking the left mouse button and dragging the mouse.
Other functions
- Follow mode
- By default the Line Graph Display starts with fololowing the current time. That is the display permanently scrolls to the last time stamp. To stop this you can switch off the follow mode via toggling the button "Follow mode"
. Switching on this button let the display continue following.
- Auto y zoom
- By clicking the button "Auto Y Zoom"
you can fit-in once the substream element in y direction.
- Auto y zoom time triggered
- By clicking the button "Auto Y Zoom Time Triggered"
you can have permanently automatic fitted-in the substream element in y direction. This is often useful when following the current time (follow mode).
- Reset Zoom
- By clicking the button "Reset Zoom"
you can reset the x zoom and thus the visible ranges of the x/time values to their initial settings.
- Equalize All Scales
- By clicking the button "Equalize All Scales"
you can set the scaling of all substream elements to a common scaling. The graph is zoomed so that the common minimal and maximum values are visible.
- Reset All Scales
- By clicking the button "Reset All Scales"
you can reset the y zoom and thus the visible ranges of the y values to their initial settings.
- Settings
- By clicking the button "Settings"
you can change some settings.
- X Range Reserve (relative) Controls the reserve distance between last signal value and right margin on the x axis. The value is relative and refers to the visible x range.
- Y Range Reserve (relative) Controls the reserve distance between last signal value and top margin on the y axis. The value is relative and refers to the visible y range.
- Signal Label Offset (pixel) Controls the x/y distance of the (value) label to the time cursor when the single selection horizontal mode is activated and the left left mouse button is clicked.
- Background Color Controls the background color of the plot.
- Grid color Controls the grid color of the plot.
- Text and Single Scale Color Controls the color of texts and the single scale y axis of the plot.