Support Request #13135
closedCAN Signal Provider still does not work in the filter graph and some more bugs in the device toolbox 3.4
Description
Supportanfrage
I think I reported the problem already with an earlier version of the device toolbox and actually I expected a fix in device toolbox 3.4 since the change log reports:
[ADEVTB-1871] - Signal Provider only look for Streaming Graph
But isn't fixed yet. I attach a demo project for CAN Signal providing attached test CAN_Signal_Providing_test.7z . One session that uses the filter graph and one session that uses the streaming graph. Only with the streaming graph I can find the signal in signal tree view.
Similar functionality in ADTF 2 was to provide the signal from all the CAN pins. Will this be enabled in ADTF 3, too?
Then there are some minor problems:
1. A display problem in the session editor. When I switch between the sessions, the default_session displays the replay Streaming Graph. But when you look at the session file, you will find that no streaming graph ist set. See attached screenshot 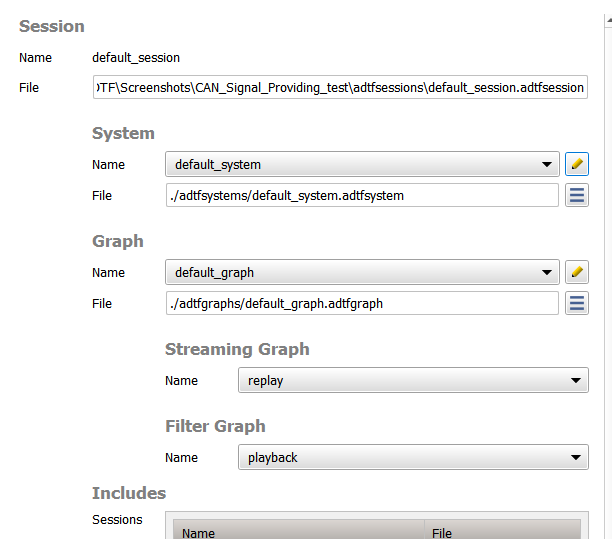 .
.
2. The Device Toolbox Example Project has an unusual directory structure. The the xml devicetoolbox.adtfproject uses wrong urls: you find url of system files going to graph files in the system directory. I tried to create a new session in the project with the using existing System "CAN Config Decoder". It reports me an error an error that the system file adtfsessions/can_config_encoder/adtfsystems/can_config_encoder.adtfgraph is not existing and the creates it. But the suffix is not ok.
3. The data trigger pins (now called runner ports?) for the decoder filters in the device toolbox are still displayed even if I disable the respective Configuration Editor setting.
Some Improvement proposal for ADTF-3.10.0
1. Would be nice if there would be an option to clone/copy a session
2. Copying and pasting from Filter Graph Editor to Streaming Graph Editor is not possible.
3. When configuring a project, or components in projects, it is convenient to have the configuration files local in the project folder, and the properties that link to the files using relative paths, e.g. $(ADTF_SESSION_DIR)/play.adtfdat. It would be convenient to have automated support for entering such relative paths. (E.g. a configuration editor setting so that a path is converted automatically to a relative one, if applicable, like available for ADTF 2).
Lösung
I think I reported the problem already with an earlier version of the device toolbox and actually I expected a fix in device toolbox 3.4 since the change log reports:
[ADEVTB-1871] - Signal Provider only look for Streaming GraphBut isn't fixed yet. I attach a demo project for CAN Signal providing attached test CAN_Signal_Providing_test.7z . One session that uses the filter graph and one session that uses the streaming graph. Only with the streaming graph I can find the signal in signal tree view.
That's true, as I must realize the fix has been only made for FlexRay, not CAN / CAN FD.
I created a new issue to adapt the changes for CAN and CAN FD as well -> ADEVTB-1917
But you can solve the use case as well right now by using the CAN Substream Decoder and Media Description Service with enabled signal property:
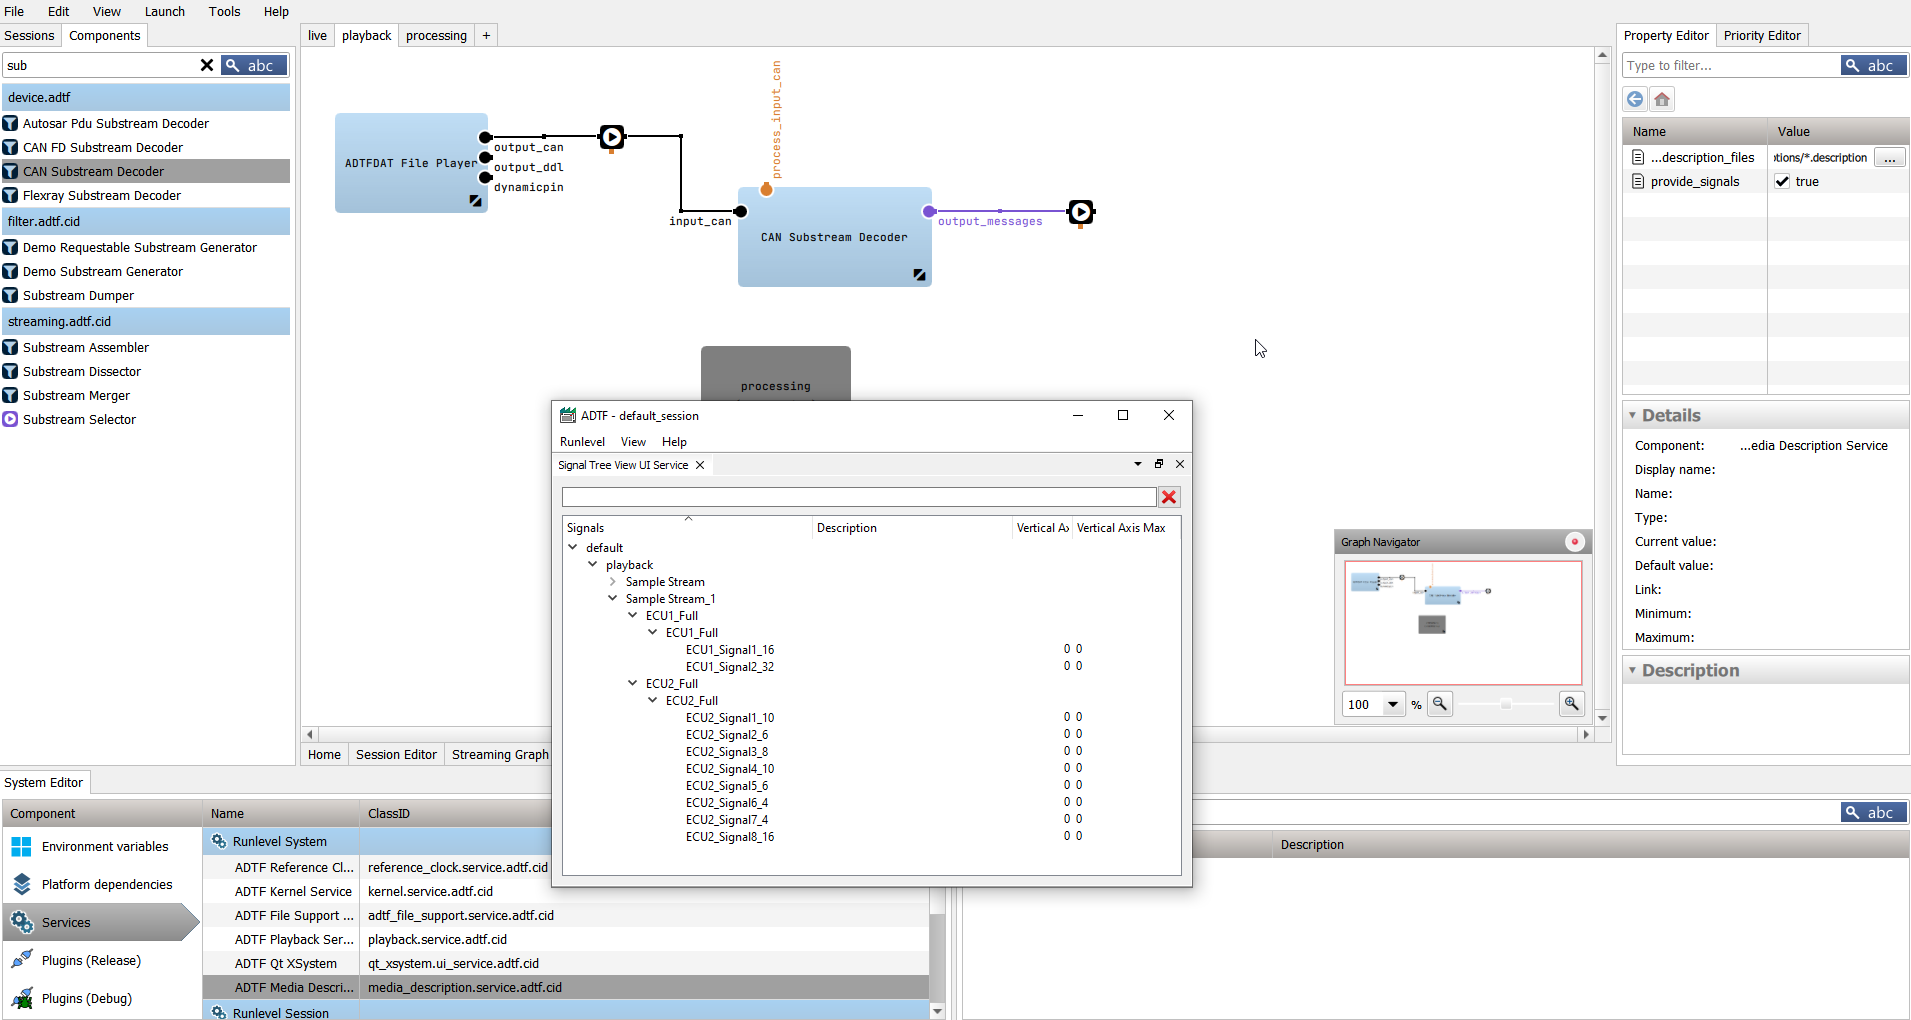
Using CAN Substream decoder as a workaround for CAN Signals. True: The Signal Tree View shows that the respective signals got registered in the Signal Registry Service (not as CAN signals but as Media Description Signals, btw. I don't understand this functionality yet). Now when this is done we could continue with the actual use case which would be to display the signals with the Signal Scope View. But this does not work yet. Is there anything else needed?
You are right, it is not working with Scope View.
The reason seems to be that the Substream Decoder Filter miss to set the timestamp, so there is no signal chart...
I only tried the Signal Table View and there the values appear (but with timestamp 0)
We will debug this issue (ADEVTB-1926), please use the table view as workaround if possible so far.
Similar functionality in ADTF 2 was to provide the signal from all the CAN pins. Will this be enabled in ADTF 3, too?
This is the same behaviour in ADTF 3.x.
All Sample Streams connected to a CAN output stream will be discovered (of course after the known issue with filter graph).
Same for CAN FD and FlexRay.
1. A display problem in the session editor. When I switch between the sessions, the default_session displays the replay Streaming Graph. But when you look at the session file, you will find that no streaming graph ist set.
I think this because both sessions using the same graph file, some refresh is missing because the session file is correct as well as the launch.
I opened a product issue (ACORE-10854).
2. The Device Toolbox Example Project has an unusual directory structure. The the xml devicetoolbox.adtfproject uses wrong urls: you find url of system files going to graph files in the system directory. I tried to create a new session in the project with the using existing System "CAN Config Decoder". It reports me an error an error that the system file adtfsessions/can_config_encoder/adtfsystems/can_config_encoder.adtfgraph is not existing and the creates it. But the suffix is not ok.
That's true, we will correct the project file -> ADEVTB-1918 created
3. The data trigger pins (now called runner ports?) for the decoder filters in the device toolbox are still displayed even if I disable the respective Configuration Editor setting.
About the wording: For data trigger pins (input pins) there exist a connected (filter) runner to manually trigger the related processing function using an active runner within the trigger pipe besides the received trigger sent via data sample stream within the data pipe.
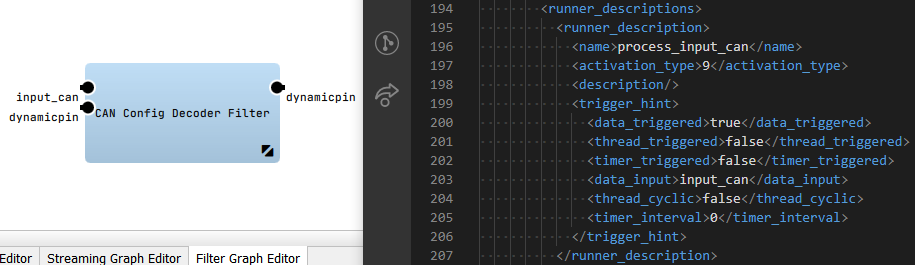
About the issue: The Configuration Editor can only hide runner containing a trigger hint with set data triggered option in plugin description:
<runner_description>
    <name>process_my_input_pin</name>
    <activation_type>9</activation_type>
    <description/>
    <trigger_hint>
        <data_triggered>true</data_triggered>
        <thread_triggered>false</thread_triggered>
        <timer_triggered>false</timer_triggered>
        <data_input>my_input_pin1</data_input>
        <thread_cyclic>false</thread_cyclic>
        <timer_interval>0</timer_interval>
     </trigger_hint>
</runner_description>
The node <trigger_hint> is new in ADTF 3.10 and its plugin description generator so it is missing in current Device TB 3.4 (build with ADTF 3.9).
Please be patent for an upcoming Device TB using ADTF >= 3.10.
Note that you can manually regenerate the plugin description for these components with ADTF 3.10 plugin description generator and getting the updated plugindescription:
$(ADTF_DIR)/bin/adtf_plugin_description_generator --plugin $(ADTF_DEVICE_TOOLBOX_DIR)/bin/can_config_decoder.adtfplugin
Would be nice if there would be an option to clone/copy a session
Ok this will save you 3 clicks, for your convenience, I created an feature request (ACORE-10855).
Due that the Streaming Graph has a complete different model and components than the Filter Graph, it is neither possible nor a valid requirement.Copying and pasting from Filter Graph Editor to Streaming Graph Editor is not possible.
Since ADTF 3.8 we recommend only use the Filter Graph which provides every needed functionality as well as cascading and including subgraphs, even from different sessions.
The Streaming Graph is even more deprecated and only for compaibility issues for older setups.
When configuring a project, or components in projects, it is convenient to have the configuration files local in the project folder, and the properties that link to the files using relative paths, e.g. $(ADTF_SESSION_DIR)/play.adtfdat. It would be convenient to have automated support for entering such relative paths. (E.g. a configuration editor setting so that a path is converted automatically to a relative one, if applicable, like available for ADTF 2).
Totally agree, we have this feature, you find a (M) Button wherever you will add paths (e.g. within Options).
Also the System Editor uses this functionality, first resolving with the best runtime macros (provided environment variables), second relative to the file within the information is stored, third choice is an absolute path (worst, maybe a different drive. You should define an environment variable in this case if you want to use the session on different machines to guarantee runtime). You can use this in FileList/FolderList Dialogs as well (e.g. ADTFDAT File Player), but as I see, its now missing in single file/folder properties due to native dialog changes... I created an issue to readd this option for this case in some way (cFilename, cFilepath) -> ACORE-10846
As mentioned, with the list dialog it is still possible for cFilenameList and cFilepathList.
Seventh: Thank you for the information on the M button. Did not know it yet. What does the "M" mean?
Macro -> using the Macro Resolver of the Session Manager
Regarding usage of (M) button (and session design in common) please also have a look at our Guide Best Practice Session Design
Files
Updated by hidden over 3 years ago
- Status changed from New to In Progress
- Topic set to DeviceTB::Common
- Support Level changed from 2nd Level to 3rd Level
- Customer set to ELEKTROBIT
- Department set to SUPPORT
- Affected Products ADTF Display Toolbox 1.5.0 added
Updated by hidden over 3 years ago
- File can_substreams_tree_view.png can_substreams_tree_view.png added
- File empty_streaming_graph.png empty_streaming_graph.png added
- File hide_runner.png hide_runner.png added
- Status changed from In Progress to Customer Feedback Required
- Resolution set to Product Issue Opened
- Product Issue Numbers set to https://www.cip.audi.de/jira/browse/ADEVTB-1917; https://www.cip.audi.de/jira/browse/ADEVTB-1918; https://www.cip.audi.de/jira/browse/ACORE-10846
Hi Anja,
thanks for the feedback !
I think I reported the problem already with an earlier version of the device toolbox and actually I expected a fix in device toolbox 3.4 since the change log reports:
[ADEVTB-1871] - Signal Provider only look for Streaming GraphBut isn't fixed yet. I attach a demo project for CAN Signal providing attached test CAN_Signal_Providing_test.7z . One session that uses the filter graph and one session that uses the streaming graph. Only with the streaming graph I can find the signal in signal tree view.
That's true, as I must realize the fix has been only made for FlexRay, not CAN / CAN FD.
I created a new issue to adapt the changes for CAN and CAN FD as well -> ADEVTB-1917
But you can solve the use case as well right now by using the CAN Substream Decoder and Media Description Service with enabled signal property:
Similar functionality in ADTF 2 was to provide the signal from all the CAN pins. Will this be enabled in ADTF 3, too?
Can you please give me more details what you mean by provide the signal from all the CAN pins ?
1. A display problem in the session editor. When I switch between the sessions, the default_session displays the replay Streaming Graph. But when you look at the session file, you will find that no streaming graph ist set.
Hm... I opened the session and unselect the Streaming Graph, Save, switch and back, everything look fine and I cannot reproduce this issue:
![]()
2. The Device Toolbox Example Project has an unusual directory structure. The the xml devicetoolbox.adtfproject uses wrong urls: you find url of system files going to graph files in the system directory. I tried to create a new session in the project with the using existing System "CAN Config Decoder". It reports me an error an error that the system file adtfsessions/can_config_encoder/adtfsystems/can_config_encoder.adtfgraph is not existing and the creates it. But the suffix is not ok.
That's true, we will correct the project file -> ADEVTB-1918 created
3. The data trigger pins (now called runner ports?) for the decoder filters in the device toolbox are still displayed even if I disable the respective Configuration Editor setting.
About the wording: For data trigger pins (input pins) there exist a connected runner (pin) to manually trigger the related processing function using an active runner within the trigger pipe besides the received trigger sent via data sample stream within the data pipe.
About the issue: The Configuration Editor can only hide runner containing a trigger hint with set data triggered option in plugin description:
<runner_description>
    <name>process_my_input_pin</name>
    <activation_type>9</activation_type>
    <description/>
    <trigger_hint>
        <data_triggered>true</data_triggered>
        <thread_triggered>false</thread_triggered>
        <timer_triggered>false</timer_triggered>
        <data_input>my_input_pin1</data_input>
        <thread_cyclic>false</thread_cyclic>
        <timer_interval>0</timer_interval>
     </trigger_hint>
</runner_description>
The node <trigger_hint> is new in ADTF 3.10 and its plugin description generator so it is missing in current Device TB 3.4 (build with ADTF 3.9).
Please be patent for an upcoming Device TB using ADTF >= 3.10.
Note that you can manually regenerate the plugin description for these components with ADTF 3.10 plugin description generator and getting the updated plugindescription:
$(ADTF_DIR)/bin/adtf_plugin_description_generator --plugin $(ADTF_DEVICE_TOOLBOX_DIR)/bin/can_config_decoder.adtfplugin
Would be nice if there would be an option to clone/copy a session
Can you explain your use case ?
A session is only a defintion of paths to a graph and system file including their property set.
Copying this will result in the same as adding a new session within an project and set this two files.
What is your purpose ?
Due that the Streaming Graph has a complete different model and components than the Filter Graph, it is neither possible nor a valid requirement.Copying and pasting from Filter Graph Editor to Streaming Graph Editor is not possible.
Since ADTF 3.8 we recommend only use the Filter Graph which provides every needed functionality as well as cascading and including subgraphs, even from different sessions.
The Streaming Graph is even more deprecated and only for compaibility issues for older setups.
When configuring a project, or components in projects, it is convenient to have the configuration files local in the project folder, and the properties that link to the files using relative paths, e.g. $(ADTF_SESSION_DIR)/play.adtfdat. It would be convenient to have automated support for entering such relative paths. (E.g. a configuration editor setting so that a path is converted automatically to a relative one, if applicable, like available for ADTF 2).
Totally agree, we have this feature, you find a (M) Button wherever you will add paths (e.g. within Options).
Also the System Editor uses this functionality, first resolving with the best runtime macros (provided environment variables), second relative to the file within the information is stored, third choice is an absolute path (worst, maybe a different drive. You should define an environment variable in this case if you want to use the session on different machines to guarantee runtime). You can use this in FileList/FolderList Dialogs as well (e.g. ADTFDAT File Player), but as I see, its now missing in single file/folder properties due to native dialog changes... I created an issue to readd this option for this case in some way (cFilename, cFilepath) -> ACORE-10846
As mentioned, with the list dialog it is still possible for cFilenameList and cFilepathList.
Updated by hidden over 3 years ago
Hi Anja,
habt ihr hierzu noch Anmerkungen, auch zu den ggf. offenen Punkten sofern nicht direkt oder indirekt erledigt ?
Ansonsten würde ich das Ticket diese Woche abschließen.
Updated by hidden over 3 years ago
Hallo Florian,
anbei die Antworten.
"
Hi,
Thanks Winkler, Anja
I even need to answer all the other stuff. (
Zero: Thanks for the details about the fixed Flexray Signal Provider and creating the tickets for the remaining Signal Providers. Would be cool if the updated functionality could also be documented in the documentation. The ADTF Device Toolbox documentation still mentions the old one:
FlexRay Signal Provider Service
Use this System Service to provide FlexRay data streams in ADTF Signal Registry. The service searches for connected FlexRay output pins in the streaming graph.
First: Using CAN Substream decoder as a workaround for CAN Signals. True: The Signal Tree View shows that the respective signals got registered in the Signal Registry Service (not as CAN signals but as Media Description Signals, btw. I don't understand this functionality yet). Now when this is done we could continue with the actual use case which would be to display the signals with the Signal Scope View. But this does not work yet. Is there anything else needed?
Second: What I mean with providing signals from CAN pins. Functionality of ADTF 2 was that the CAN signal provider provided signals from all output pins with major type MEDIA_TYPE_CAN and subtype MEDIA_SUBTYPE_CAN_DATA (and also the old CAN subtype). Use case is that you can also check CAN signals for generated CAN samples.
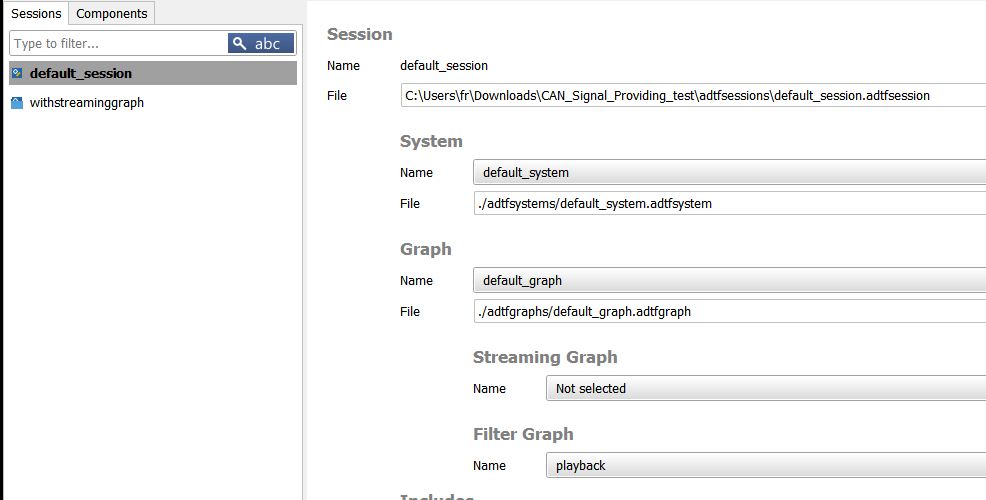
Third: For reproducing the display bug in the session editor, I can proceeed as follows 1. Open the project attached to the ticket. The default session is activated 2. Open the Session Editor, I can see that the Stream Graph is Not selected 3. Activate the Session "withstreaminggraph" (double click) 4. Activate the session "default_session". Now the Streaming Graph Displayed in the session editor is "replay". As in the attached pic.
Fourth: Use case for copying between Streaming Graph and Filter Graph. I want to copy the "ADTFDAT File Player" with the set .adtfdat file and the pins. This was needed here when I created the project attached. And will also be needed when converting older project with Streaming Graph and adding all the elements to the filter graph (copying from Streaming Graph to Filter Graph). Since ADTF 3.8 all the streaming graph elements can be used in the filter graph, and I read about the anouncement that the streaming graph gets deprecated. So I wanted to remove it from the training material, but for now it is still required. Now I hope to get rid of it with Device Toolbox 3.5
Fifth: Use case for copying/cloning sessions. I want to have another session in the project with the equivalent settings. (Same Graph File, Same System File, Same Filter Graph). After copying I can modify the copied session, for example I can select another Filter Graph. I think this will appear quite often, for example when I created the attached project, this would have saved me some clicks. In ADTF 2 changing the Filter Graph was even more easy, just a double click.
Sixth: Thanks for the details about the enabled trigger hints, I also find that configuration editor displays warnings on wrong connections. Did not check for runtime l(launcher functionality on wrong connections) yet. Also good to know the wording, since the documentation does not tell us much here. (The Guide uses "runner pin" once). I was using the following terminology:
Pins at the top of the filter graph elements: trigger pin (using a qualifier depending on the trigger hint, so "data trigger pin" is not the input pin, I meant a trigger pin) -> should now be runner port
Pins at the bottom side of a filter graph elements: trigger pin -> How would you call them?
Pins on the left side of a graph element: Input pin, Data binding pin, or Interface binding pin, Client pin
Pins on the right side of a graph element: Output pin, Data binding pin, or Interface binding pin, Server pin
Seventh: Thank you for the information on the M button. Did not know it yet. What does the "M" mean? I played around with selecting ADTFDAT Files and found that it does not provide the functionality I need. It is able to use the $(ADTF_DIR) variable but it does not use the $(ADTF_SESSION_DIR) variable which I would prefer when adding configuration files and adtfdat files inside the project folder. Second there seems to be a bug: it converts direct relative paths like e.g. "../../play.adtfdat" (such that replay works) to nonexisting absolute paths.
Eigth: The Filenamelist thing reminded me of the following, not sure but probably I reported this also two or three device toolbox versions more early. The can_channel properties of the CAN Signal Provider service are cFilenames, but they should be cFilenameLists.
"
Updated by hidden over 3 years ago
- Product Issue Numbers changed from https://www.cip.audi.de/jira/browse/ADEVTB-1917; https://www.cip.audi.de/jira/browse/ADEVTB-1918; https://www.cip.audi.de/jira/browse/ACORE-10846 to https://www.cip.audi.de/jira/browse/ADEVTB-1917; https://www.cip.audi.de/jira/browse/ADEVTB-1918; https://www.cip.audi.de/jira/browse/ACORE-10846; https://www.cip.audi.de/jira/browse/ADEVTB-1926; https://www.cip.audi.de/jira/browse/ACORE-10854; https://www.cip.audi.de/jira/browse/ACORE-10855
Hi Anja,
Zero: Thanks for the details about the fixed Flexray Signal Provider and creating the tickets for the remaining Signal Providers. Would be cool if the updated functionality could also be documented in the documentation. The ADTF Device Toolbox documentation still mentions the old one:
FlexRay Signal Provider ServiceUse this System Service to provide FlexRay data streams in ADTF Signal Registry. The service searches for connected FlexRay output pins in the streaming graph.
Thanks for the hint, it is already updated for next version within a common documentation branch.
First: Using CAN Substream decoder as a workaround for CAN Signals. True: The Signal Tree View shows that the respective signals got registered in the Signal Registry Service (not as CAN signals but as Media Description Signals, btw. I don't understand this functionality yet). Now when this is done we could continue with the actual use case which would be to display the signals with the Signal Scope View. But this does not work yet. Is there anything else needed?
You are right, it is not working with Scope View.
The reason seems to be that the Substream Decoder Filter miss to set the timestamp, so there is no signal chart...
I only tried the Signal Table View and there the values appear (but with timestamp 0)
We will debug this issue (ADEVTB-1926), please use the table view as workaround if possible so far.
Second: What I mean with providing signals from CAN pins. Functionality of ADTF 2 was that the CAN signal provider provided signals from all output pins with major type MEDIA_TYPE_CAN and subtype MEDIA_SUBTYPE_CAN_DATA (and also the old CAN subtype). Use case is that you can also check CAN signals for generated CAN samples.
This is the same behaviour in ADTF 3.x.
All Sample Streams connected to a CAN output stream will be discovered (of course after the known issue with filter graph).
Same for CAN FD and FlexRay.
Still misunderstand you ?
Third: For reproducing the display bug in the session editor, I can proceeed as follows 1. Open the project attached to the ticket. The default session is activated 2. Open the Session Editor, I can see that the Stream Graph is Not selected 3. Activate the Session "withstreaminggraph" (double click) 4. Activate the session "default_session". Now the Streaming Graph Displayed in the session editor is "replay". As in the attached pic.
Now I understand, thank you.
I think this because both sessions using the same graph file, some refresh is missing because the session file is correct as well as the launch.
I opened a product issue (ACORE-10854).
Fourth: Use case for copying between Streaming Graph and Filter Graph. I want to copy the "ADTFDAT File Player" with the set .adtfdat file and the pins. This was needed here when I created the project attached. And will also be needed when converting older project with Streaming Graph and adding all the elements to the filter graph (copying from Streaming Graph to Filter Graph). Since ADTF 3.8 all the streaming graph elements can be used in the filter graph, and I read about the anouncement that the streaming graph gets deprecated. So I wanted to remove it from the training material, but for now it is still required. Now I hope to get rid of it with Device Toolbox 3.5
Understand your purpose, but as said we cannot solve a copy/paste between SG and FG.
You can leave older sessions with SG and only create new ones without.
The SG is deprecated but will never be removed due to this compatibility requirement.
Fifth: Use case for copying/cloning sessions. I want to have another session in the project with the equivalent settings. (Same Graph File, Same System File, Same Filter Graph). After copying I can modify the copied session, for example I can select another Filter Graph. I think this will appear quite often, for example when I created the attached project, this would have saved me some clicks.
Ok this will save you 3 clicks, for your convenience, I created an feature request (ACORE-10855).
In ADTF 2 changing the Filter Graph was even more easy, just a double click.
Just a dropdown in ADTF 3.x Session Editor instead of a double click in ADTF 2.x Project Tree, same follow up.
In ADTF 2.x the context within the Configuration Editor was a config, in ADTF 3.x a session.
Both containing a graph(file), and you select an active filter graph.
So there you won't get rid of a click but imho it is the same skill level :-)
Sixth: Thanks for the details about the enabled trigger hints, I also find that configuration editor displays warnings on wrong connections. Did not check for runtime l(launcher functionality on wrong connections) yet.
The API will warn you the same
Also good to know the wording, since the documentation does not tell us much here. (The Guide uses "runner pin" once).
We rework the (streaming) architecture in upcoming ADTF 3.11, hope this will help even more.
I will check mismatches regarding wording again in the current version.
I was using the following terminology:
Pins at the top of the filter graph elements: trigger pin (using a qualifier depending on the trigger hint, so "data trigger pin" is not the input pin, I meant a trigger pin) -> should now be runner port
A Filter has never a port, only pins.
In the context of graph components every connectable filter entry point is a pin.
So we speak about Input Pins on the left, Output Pins on the right and on Runner at the top, Pins for Runner are not required.
The wording port is used with exchange points between Streaming and Filter Graph or Filtergraph and Subgraph.
I updated my last comment: For data trigger pins (input pins) there exist a connected runner (pin) to manually trigger the related processing function using an active runner within the trigger pipe besides the received trigger sent via data sample stream within the data pipe
As said, I will check the documentation again...
Pins at the bottom side of a filter graph elements: trigger pin -> How would you call them?
Don't exist for filter and friends, only for Sample Streams to access the trigger send by Streaming Data Pipe (since ADTF 3.10).
so it would also be a runner in this which provides a trigger.
Pins on the left side of a graph element: Input pin, Data binding pin, or Interface binding pin, Client pin
yes
Pins on the right side of a graph element: Output pin, Data binding pin, or Interface binding pin, Server pin
yes
Seventh: Thank you for the information on the M button. Did not know it yet. What does the "M" mean?
Macro -> using the Macro Resolver of the Session Manager
Regarding usage of (M) button (and session design in common) please also have a look at our Guide Best Practice Session Design
I played around with selecting ADTFDAT Files and found that it does not provide the functionality I need. It is able to use the $(ADTF_DIR) variable but it does not use the $(ADTF_SESSION_DIR) variable which I would prefer when adding configuration files and adtfdat files inside the project folder. Second there seems to be a bug: it converts direct relative paths like e.g. "../../play.adtfdat" (such that replay works) to nonexisting absolute paths.
Yeah, we found out it uses only Configration macros not runtime macros.
We already fixed that in current master and will be part of upcoming ADTF 3.11.
Eigth: The Filenamelist thing reminded me of the following, not sure but probably I reported this also two or three device toolbox versions more early. The can_channel properties of the CAN Signal Provider service are cFilenames, but they should be cFilenameLists.
"
Yes, they will be changed in upcoming Device Toolbox 3.5.0
Updated by hidden over 3 years ago
Addtional information:
I updated my last response #13135#note-5 for additional information about macro resolving, common session design and the the (M) button:
Regarding usage of (M) button (and session design in common) please also have a look at our Guide Best Practice Session Design
Updated by hidden over 3 years ago
Hello Florian,
Thanks for all the information, creating the tickets and also on the planned updates! We are looking forward to ADTF 3.11 and DT 3.5.
From our trainer:
"I have just one comment concerning the terminology of runner pins. The Configuration Editor has the following Graph Editor setting "Show runner ports even for data triggered runners". Functionality is that runner pins with a data tigger hint are not displayed any more. Using the term "runner port" here seems to be missleading."
and regarding your last edit:
"
Thanks for the updates in the documentation. So the online documention already shows the usage of $(ADTF_SESSION_DIR), which will then work in the next release 3.11. Maybe one possible improvement:
To set up the path as macro, you have to follow these steps:
Choose the Environment Variables tab of the ADTF Session EditorI think you mean the ADTF System Editor instead of the Session Editor.
"
BR,
Anja
Updated by hidden over 3 years ago
Hi Anja,
"I have just one comment concerning the terminology of runner pins. The Configuration Editor has the following Graph Editor setting "Show runner ports even for data triggered runners". Functionality is that runner pins with a data tigger hint are not displayed any more. Using the term "runner port" here seems to be missleading."
That is true. I will discuss and check this to fix.
I think you mean the ADTF System Editor instead of the Session Editor.
Also true, I will instantely fix this.
If all questions seems to be solved, I would suggest to close the support request ?
Updated by hidden over 3 years ago
Hello Florian,
yes we can close this request.
Thank you.
BR, Anja
Updated by hidden over 3 years ago
- Project changed from 7 to Public Support
- Description updated (diff)
- Status changed from Customer Feedback Required to To Be Closed
- Private changed from Yes to No