 ADTF Configuration Editor
This guide covers what a session is and where the ADTF Configuration Editor (CE) comes into play. After reading this guide, you will know:
- The different files you need to know in ADTF
- How to create projects and sessions with the CE
- How to launch and connect to a session
- How to work with the CE in common
Table Of Content
Restrictions
Read-Only Mode to view the sessions, graphs, systems and their properties without edit functionality (this is still part of the
Developer License). So these are the limitations, other functions like launching tools or sessions or navigate from Home
will work the same.
--reset to
set back to delivery state. The same can occur if your adtf_configuration_editor.cesettings has been damaged.
Available commands
Although the CE is a GUI application it still has some command line arguments.
Type: adtf_configuration_editor.exe --help into a console to get the list of the supported command line arguments:
ADTF Configuration Editor

adtf_configuration_editor

Usage:
        adtf_configuration_editor [--help] [--debug-panel] [--enable-logging] [--reset] [--profiler]
                                  [--profiler-dump-file <filename>] [--settings <cesettingsfile>]
                                  [--environment <adtfenvironmentfile>] [--project <project>]
                                  [<adtfproject>]

Options:
        --help, -h  Print the usage info and quit.
        --debug-panel
                    Enable debug window.

        --enable-logging
                    Redirect message buffer of CE to CE Log View (including JS/QML).

        --reset, -r Delete all user specific entries.
        --profiler  Start easy profiler thread and open port.
        --profiler-dump-file <filename>
                    Enables profiling right from the start. When ADTF shuts down, profiling data
                    will be dumped to the given file.

        --settings <cesettingsfile>
                    Path to a .cesettings file that should be used instead of the default one (in
                    your home directory).

        --environment <adtfenvironmentfile>
                    Specify an ADTF environment file that should be loaded. This is also stored in
                    the used .cesettings file.

        --project <project>
                    Path to the .adtfproject file. Note: Explicit option --project does not work in
                    combination with using <adtfproject> as argument.

        <adtfproject>
                    Path to the .adtfproject file.
Files you need to know
Creating a new project with the CE results in a new folder named after the project, containing:
- A project file
*.adtfprojectwhich defines - Names and paths to all session files (
*.adtfsession) - Names and paths to all graph files (
*.adtfgraph) - Names and paths to all system files (
*.adtfsystem) - A new folder named adtfsessions
- New session files are created here. These files have the suffix
*.adtfsessionand define the path to the selected - system file
- system properties file
- graph file
- graph properties file
- The system file for providing the features, required platform dependencies, environment variables to use and plugins to load
- The graph file for data receiving/sending/processing, filtering, calculation, visualisation, etc.
- A new folder named adtfgraphs
- New graph files are created here. These files have the suffix
*.adtfgraphand contain - all created filter graphs as XML structure and the components they consist of
- The layout attributes of a graph are stored in a file called
*.adtfconfiglayout - The properties of a graph changed by the user are stored in a file called
*.adtfproperties - A new folder named adtfsystems
-
When new system descriptions are created the
*.adtfsystemfiles representing them at file level, are created here. Such a file contains - a list of environment variables
- the platform dependend binaries
- a list of plugin descriptions to load
- an ordered list of services to load
- The properties of a system configuration changed by the user are stored in a file called
*.adtfproperties
Basics
Some important common information for each part of the CE in general.
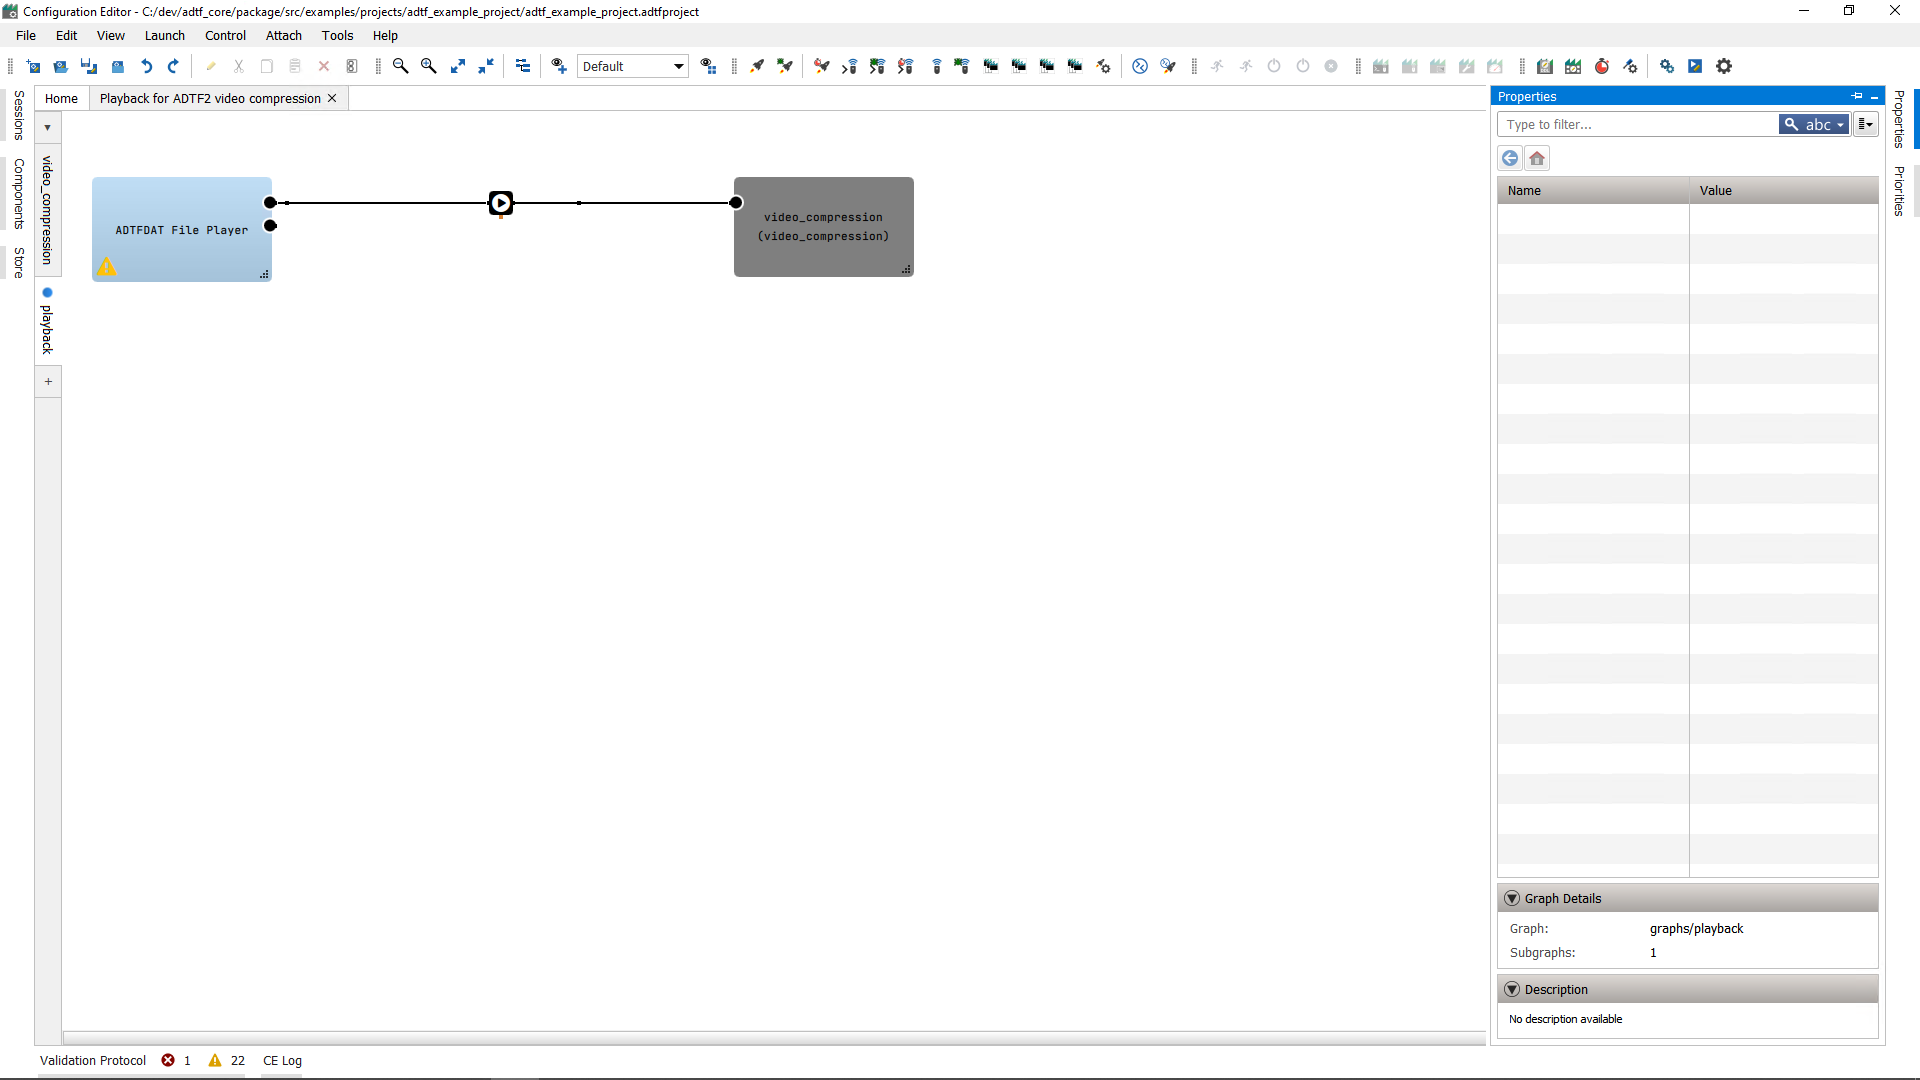
Appearance
After loading a project, the CE will appear similiar to the following screenshot:
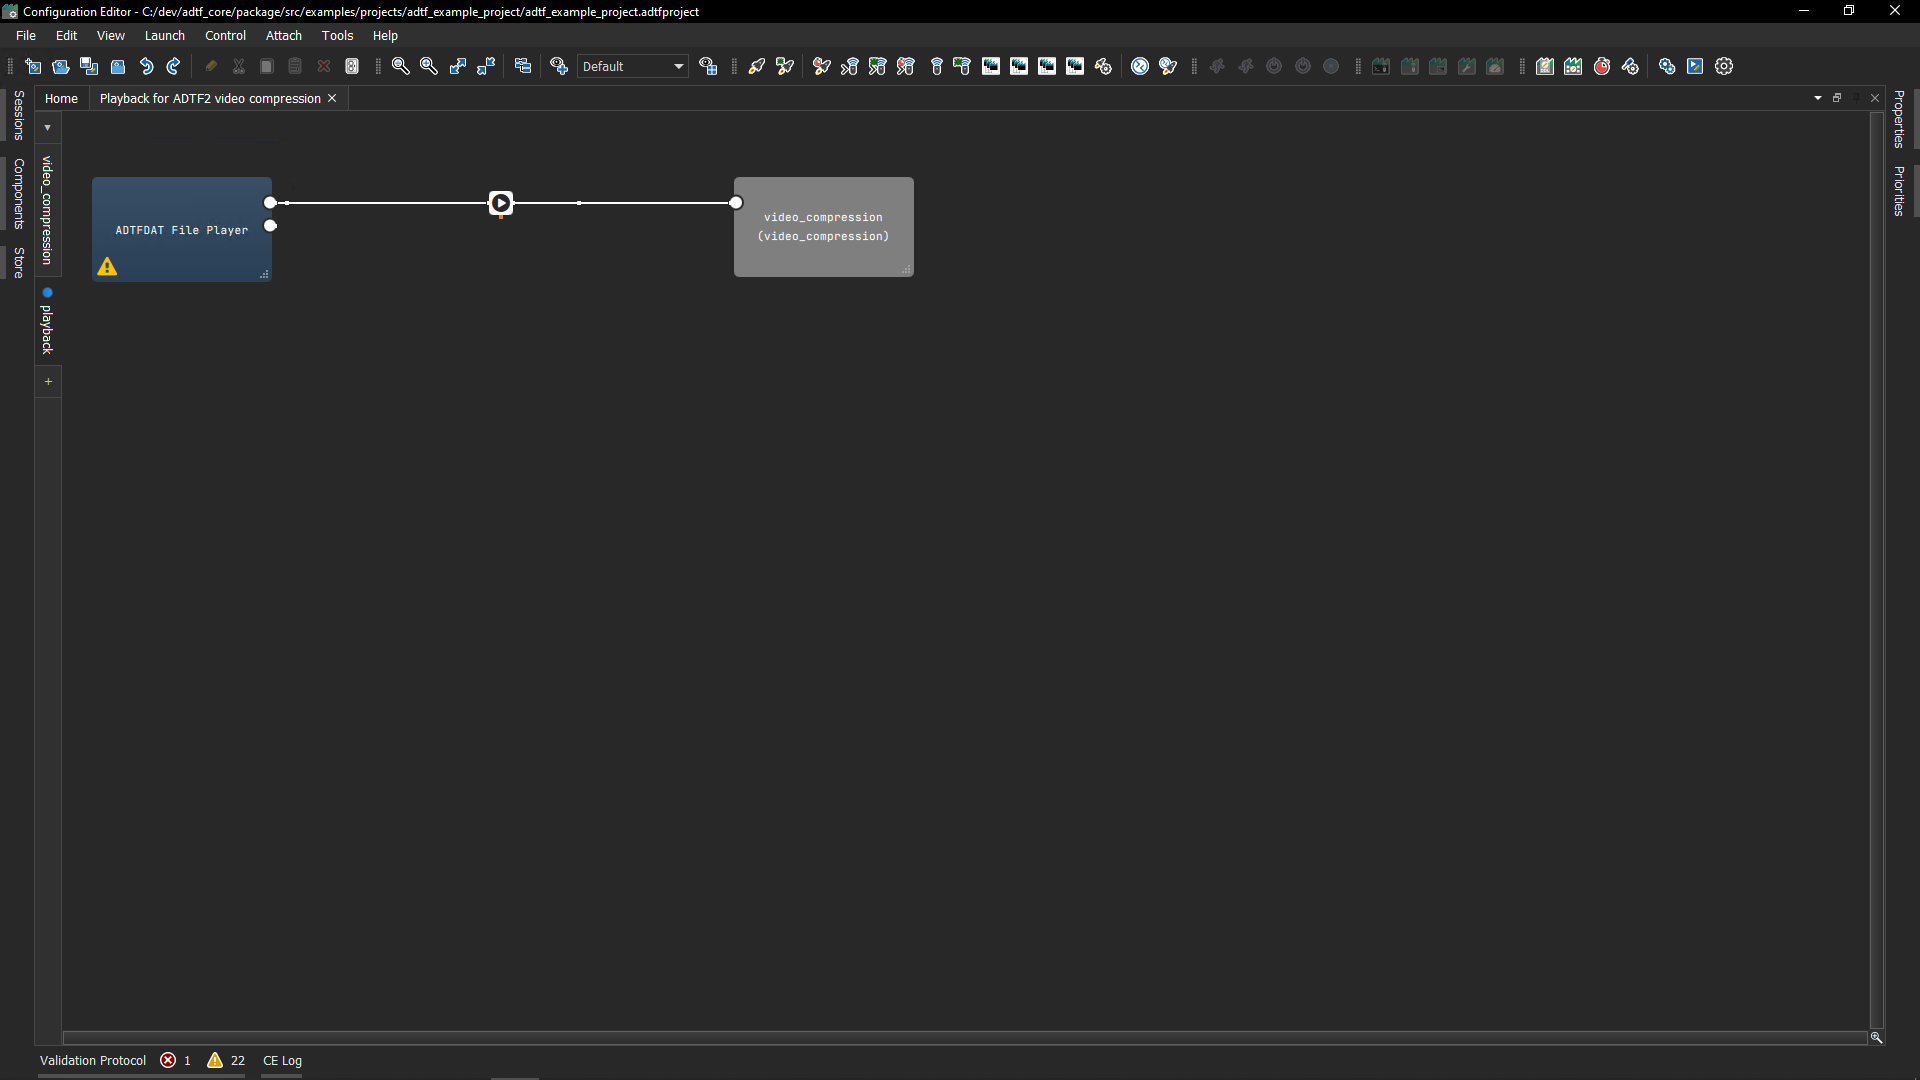
As you might know and expect from other application, you can switch to a dark theme as well (see Tools > Options... > General):
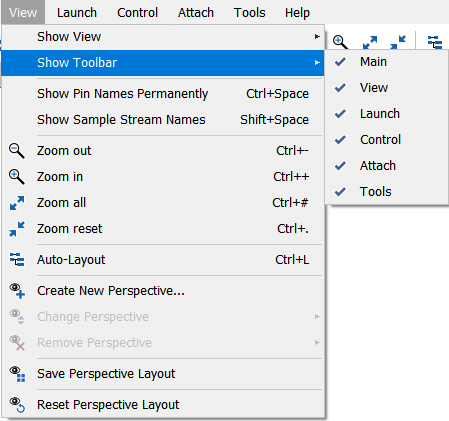
Perspectives
The CE is a combination of different views (widgets) and comes with a default perspective (layout), which can be resetted anytime under View. Within this menubar entry you are able to enable or disbale these views and save own perspectives, which can be used and switched for different use cases.
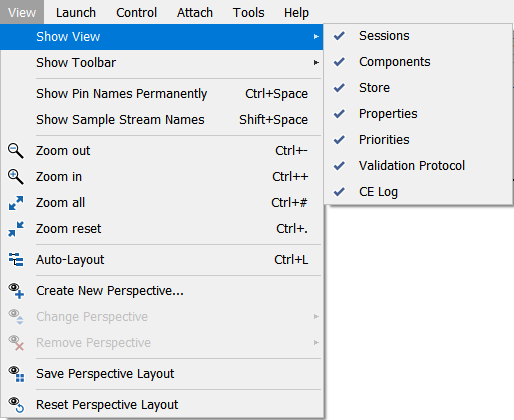
This is very helpful especially when you do not only want to enable or disable specific views, you can also tab, dock, float, pin or rearrange each view including resizing and auto-hover.
Toolbar
The most useful menubar entries are also available as toolbar, which can be also hide, move or float like each view widget.
Common Usage
Each view has a different purpose, but it is also very important to know that they are connected to each other for interaction and provide the same behavior.
You will find a search bar in almost every view including the possibilty for changing search behavior, filtering, sorting and many more. For that, use the buttons on the right of the searchbar:

Another basic behavior is that every view has a context menu with all available actions with its specific purpose.
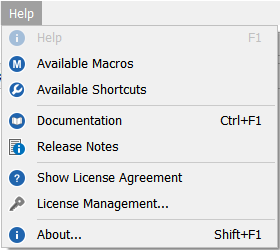
As you can see within this context menu there is also a Help entry which is provided on several places within the entire CE (especially for usable components like filters and services),
which can be also triggered when selected by hitting F1. Furthermore, the menubar provides also a common Help entry.
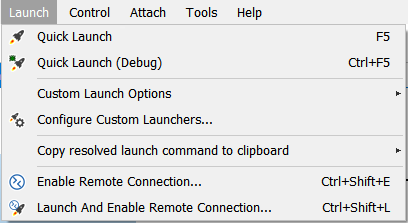
Launch, Connect, Control and Attach
Within section Sessions you will learn, how a session can be launched, connected, controled and attached. Please also keep in mind, that launching and any remote access to a session is a very central use case so it is also available in the menubar and not only within the context menu of a session.

System Editor
The System Editor is available when a session has been selected to configure any runtime dependency or functionality. It can be opened from Sessions, Filter Graph Editor or directly via the menubar.
If your session incorporates with filter, streaming sources or streaming sinks that have dependencies to libraries outside of ADTF this is the right place to define them.
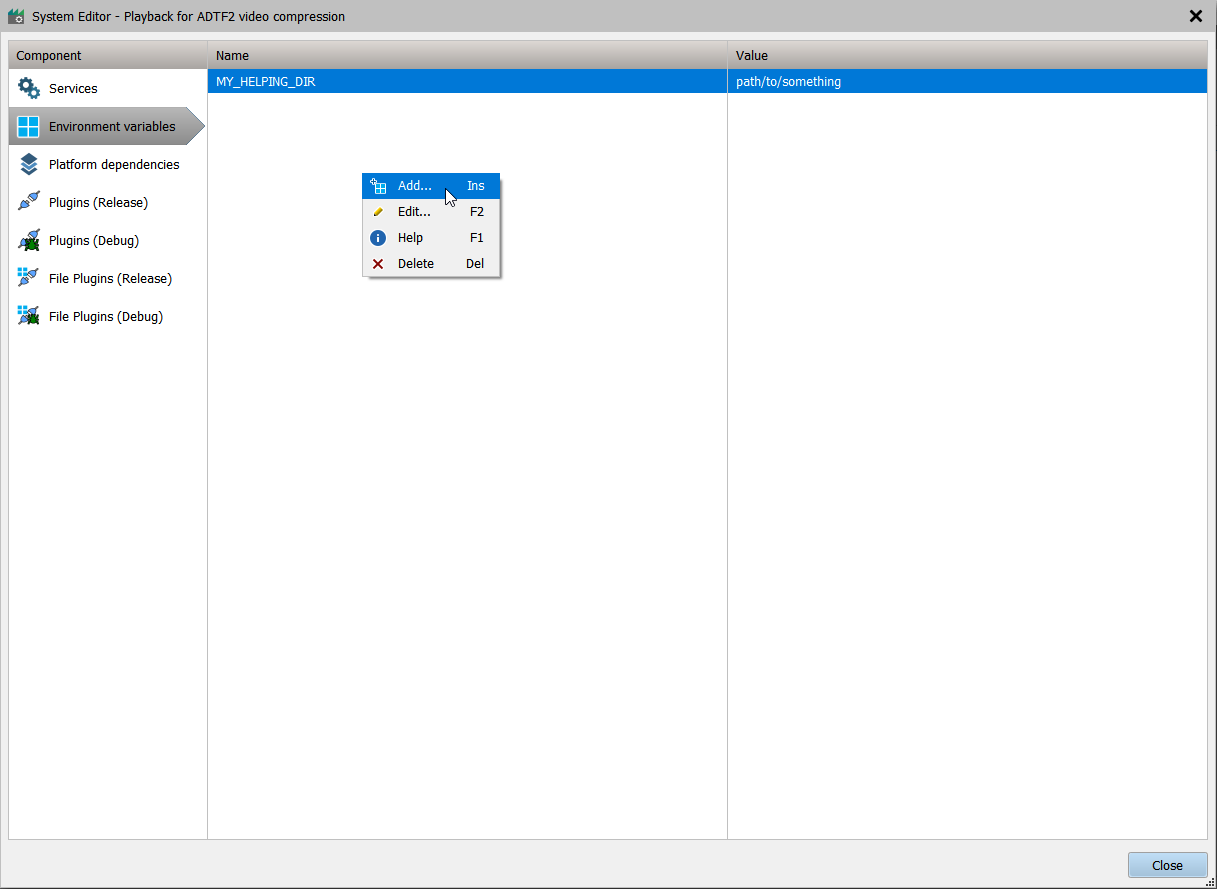
Environments variables are useful to abstract away from platform specific paths usable as macros which makes it easier to transfer project
files between different PCs or operting systems. You can define additional platform dependencies (e.g. OpenCV or Qt DLL libraries),
services and plugins (*.adtfplugins).
If a component defines its dependencies (services, shared libraries) properly, the required services are added automatically as soon as the component has been dropped from the Components view into an Filter Graph Editor. If you want to know more about how components can define their dependencies follow this link.
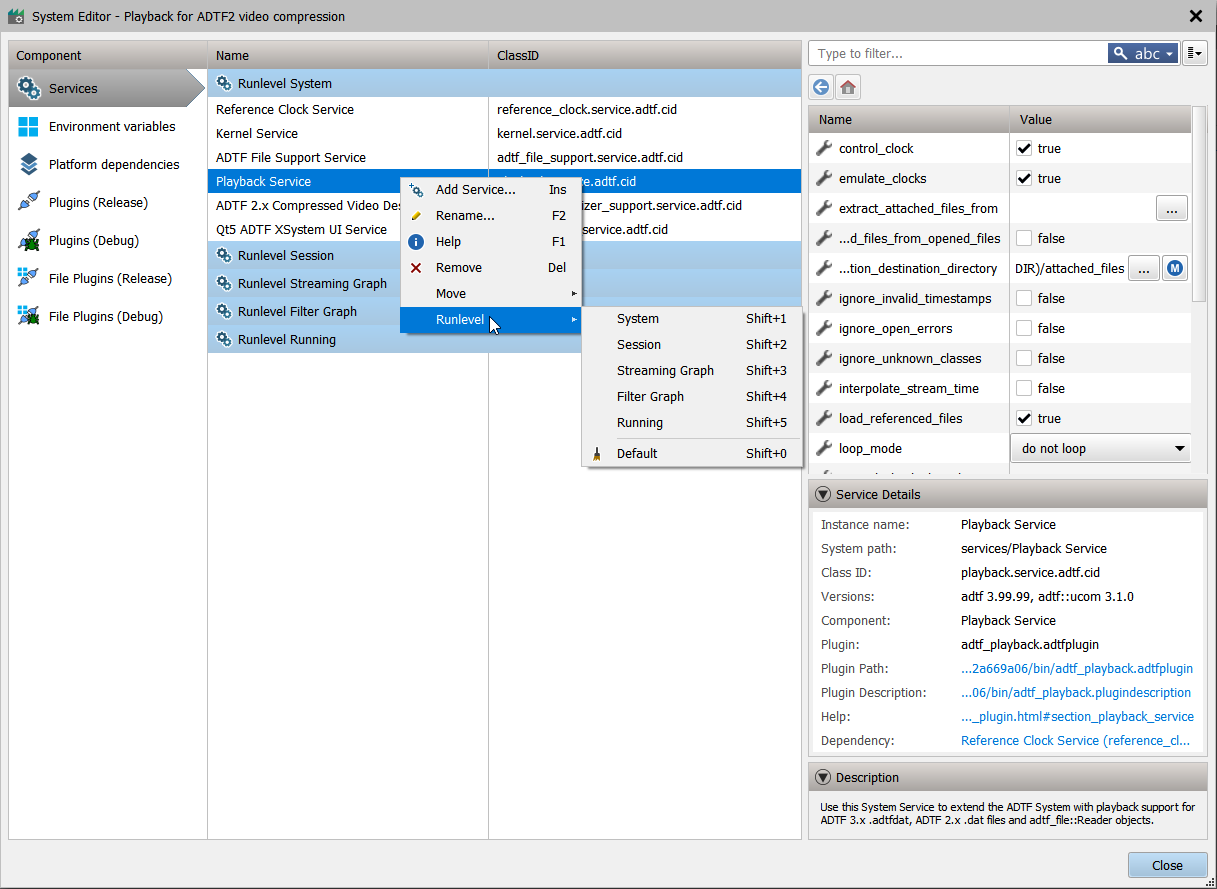
The order in wich services are loaded can be influenced in two ways:
- Services are loaded in a defined runlevel and can be changed in the System Editor
- Services are loaded in the order they are defined in the System Editor. This order can be change with the up and down buttons.
In order to avoid invalid system file paths when distributing a project, define an environment variable to abstract away the system file path using them as macros. All you have to do when moving to a different PC is adjust the environment variable accordingly.
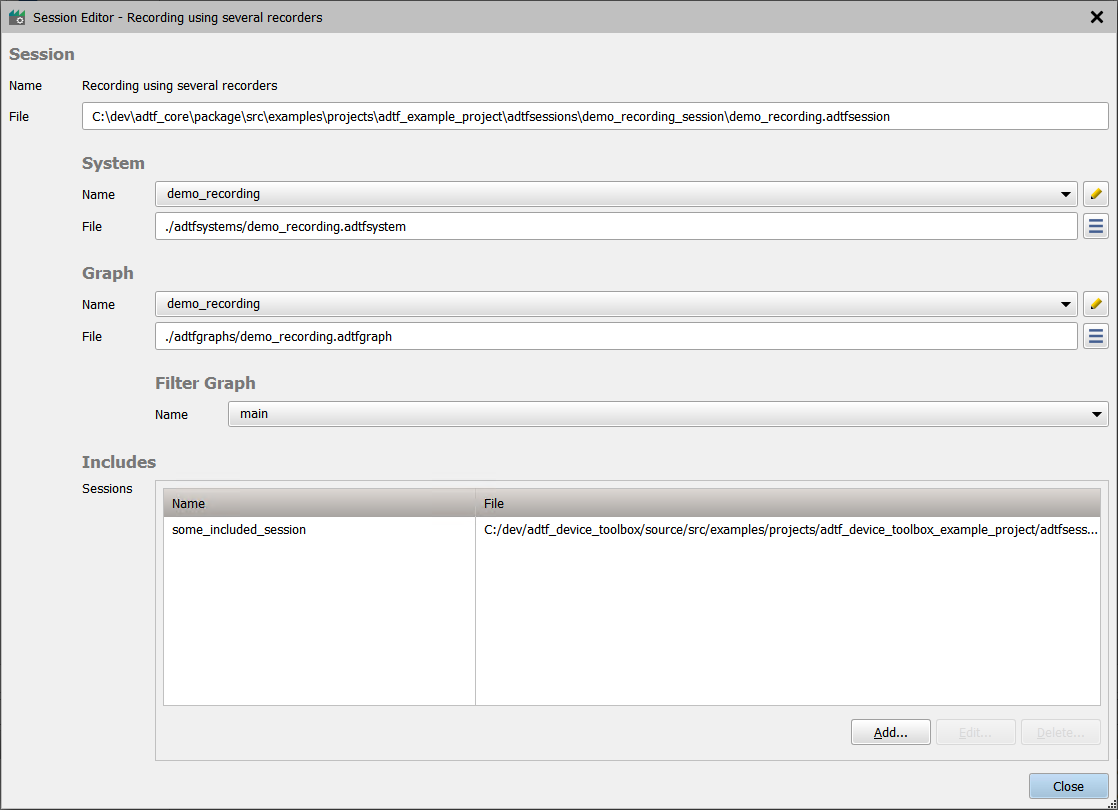
Session Editor
The Session Editor is available when a session has been selected to create the used graph, system and property file. It can be opened from Sessions, Filter Graph Editor or directly via the menubar.
You can also include graphs from other sessions, especially for reusability issues. To make them available in the list of available subgraphs inside the Filter Graph Editor, you have to add the related sessions here in Session Editor. Including a graph from another session will not be a copy (only linked) and treated the same as adding a subgraph, but more like a blackbox - your scope will stay in the current session you are working on.
Areas
In order to start the CE go to the
bin directory of the ADTF directory
and double click on the adtf_configuration_editor.exe file.
The different views of the CE
- Sessions - Manage, launch and connect to sessions within your project
- Components - Already available components to be used within the graph
- Store - Additional components available for download
- Home - Landing Page and personalizable dashboard
- Filter Graph Editor - Data receiving/transmitting/processing, filtering, calculation, visualisation, etc
- Properties - Tweak the available settings of the selected component
- Priorities - Adapt the priorities of components and connections
- Validation Protocol - Listing current configuration problems
- CE Log - The console output from CE itself (including JS/QML)
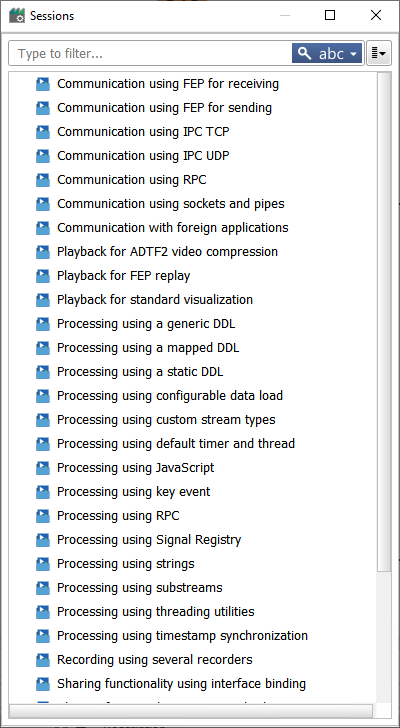
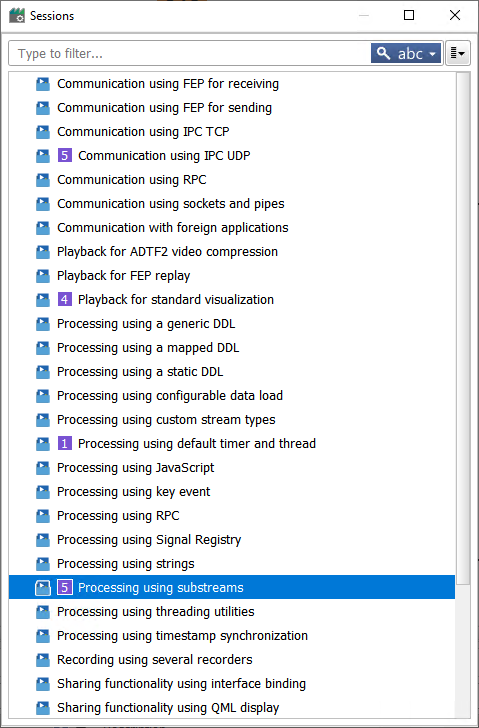
Sessions
This is the entry point after creating or loading a project, where you can switch, add or remove the containing sessions showing also their hierarchical relation when included. To define the relation between graph, system and properties within a session, please use the Session Editor. To configure and extend the functionality of a session for runtime, please use the System Editor.
Common overview
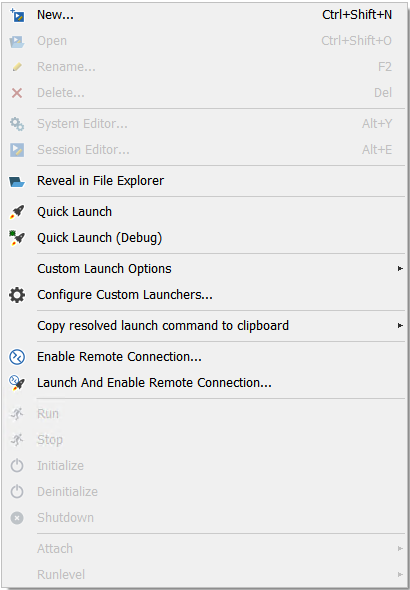
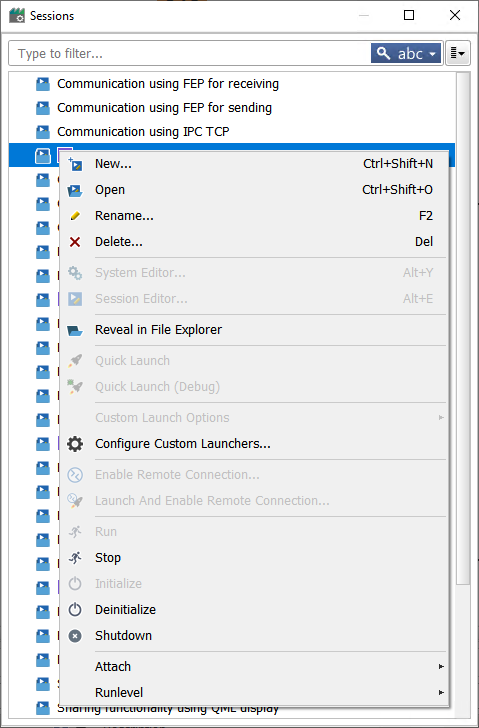
Available options
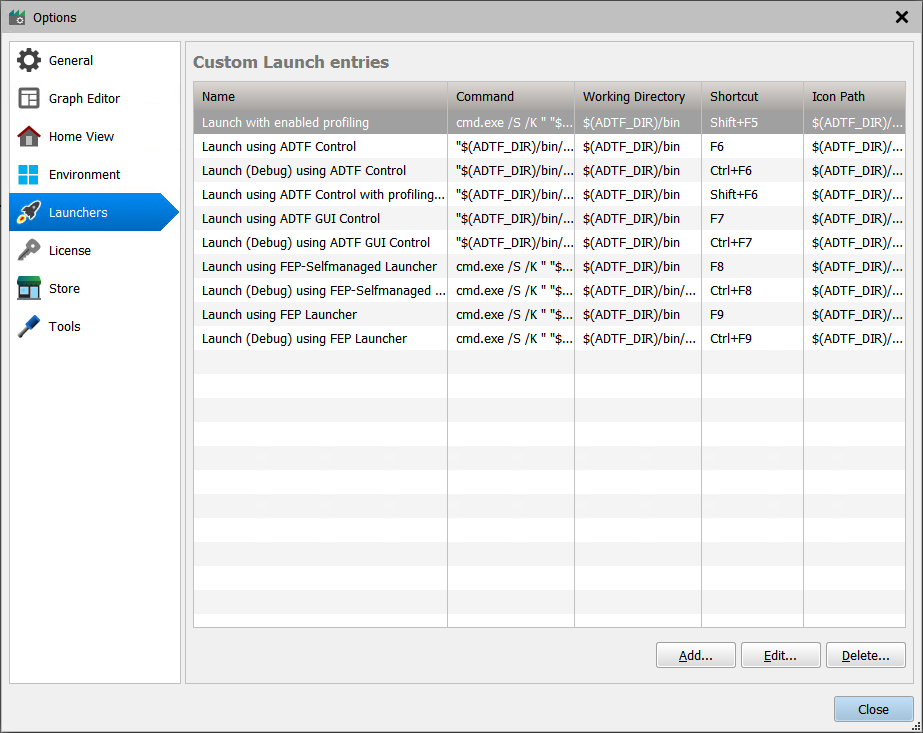
Besides basic adding, renaming, opening and removing sessions from your loaded project, the context menu contains quick launch options and entries for custom launch defintions (see Tools > Options... > Launchers).
cmd on Windows (x86_64) and xterm on Linux (x86_64). For the Custom Launch Options you can adapt the behaiviour but for the both
quick launch options make sure the related packages are installed, especially xterm on Linux (x86_64). Otherwise launching a session from CE won't work (see System Requirements).
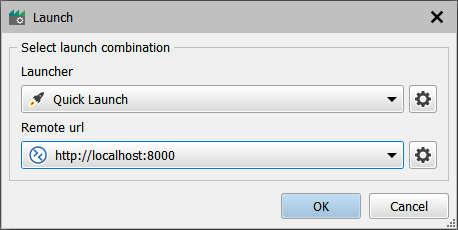
The CE implements an RPC client which makes it possible to connect to a session - better say the related RPC interface of the ADTF Launcher. This will provide the user the option to remote control from within the Sessions in following two ways:
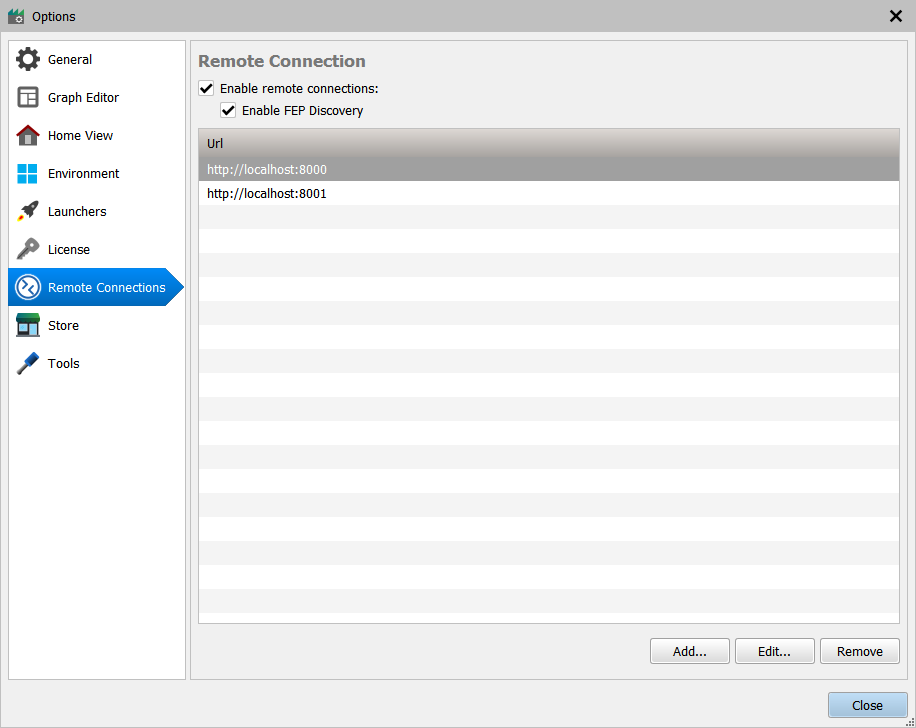
Under Tools > Options... > Remote Connections it is possible that the CE will always automatically connect to specified url, no matter if already running or needs to be launched, it will polled and connected when available: These can used with any specifed launcher by using the generic Launch... command:
Once there are one or more sessions connected, it will be visualized within the Sessions view by displaying the current runlevel:
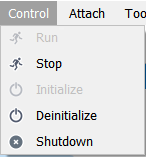
Within the context menu you will find options to control the session after launched and connected, e.g. to control runlevels, attach with other ADTF tools or handle running transitions like start, stop or init steps.
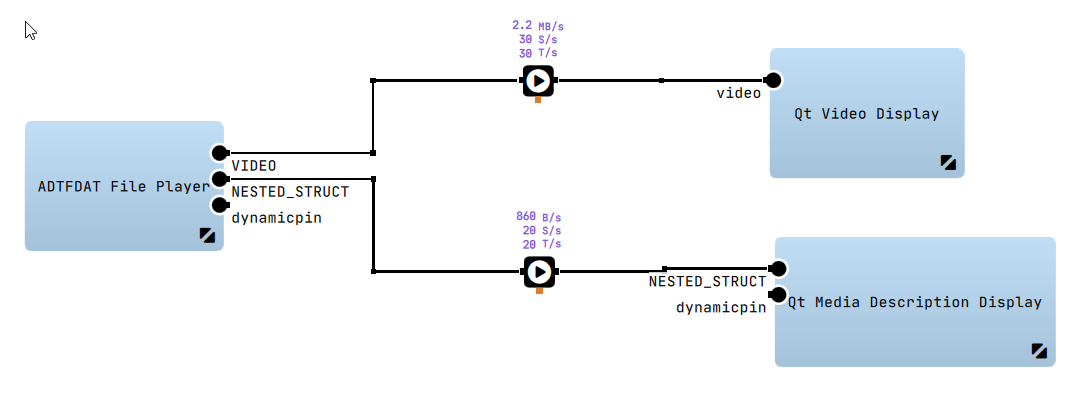
Another benefit is the visualization of live statistics directly at the Sample Streams within the Filter Graph Editor:
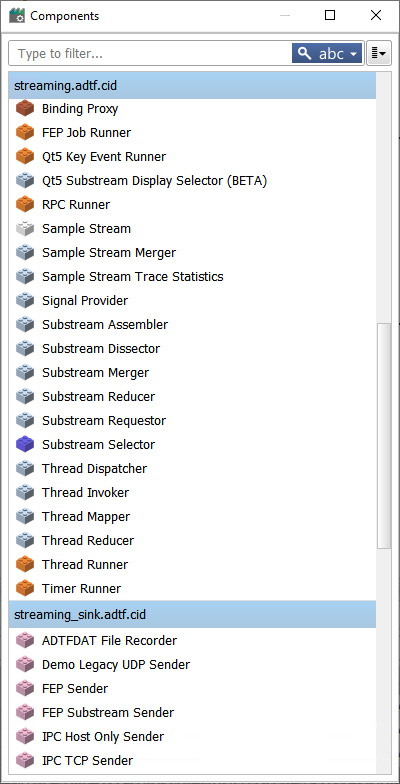
Components
The Component view holds the elements that can be drag and droped into the Graph Editor. You can choose between Type and Class ID for grouping.
Store
The CE also provides a integrated client to acces one ore more component stores. This view enables the user to search for available adtfplugins and components within the configured stores.
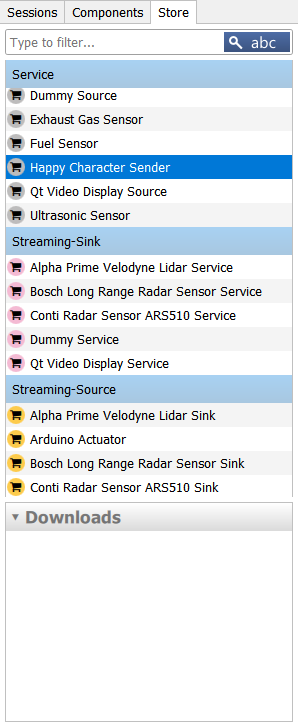
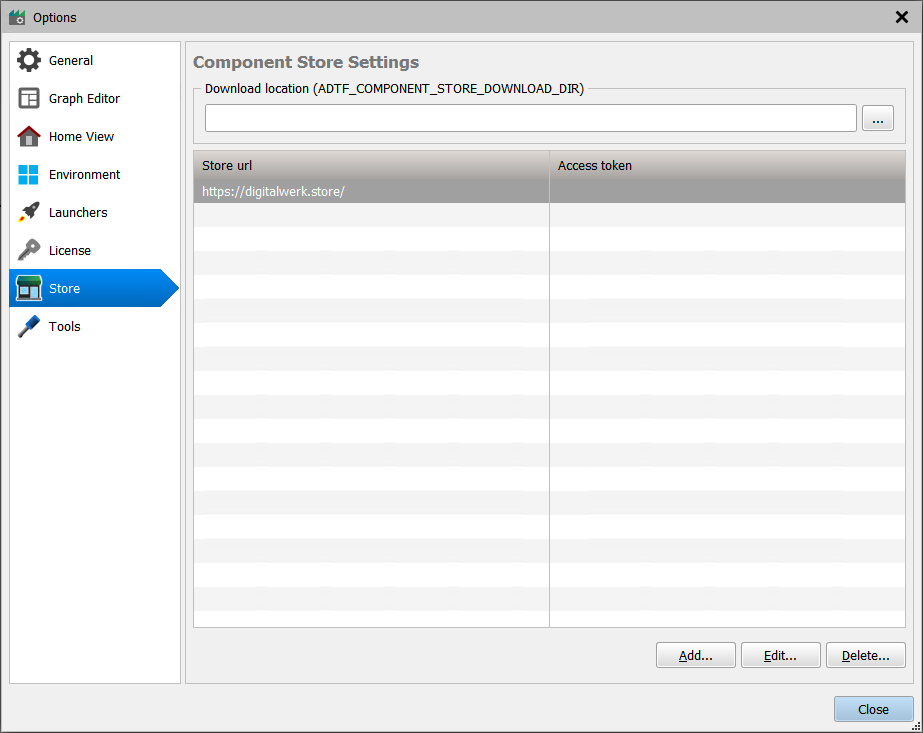
After that the associated settings can be configured and found under Tools > Options... > Store. The desired stores can be enabled by adding a URL and acces token to the list. Before a adtfplugin can be downloaded a location must be defined. Now the view can be used to browse and download the desired adtfplugins.
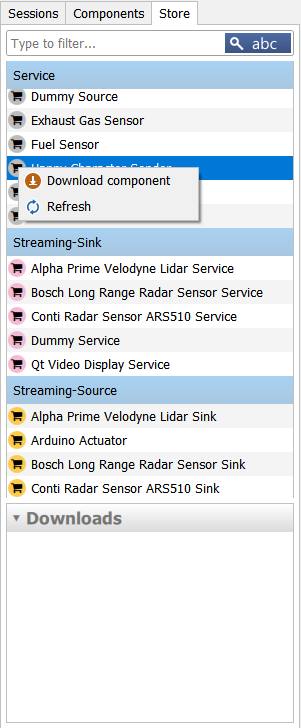
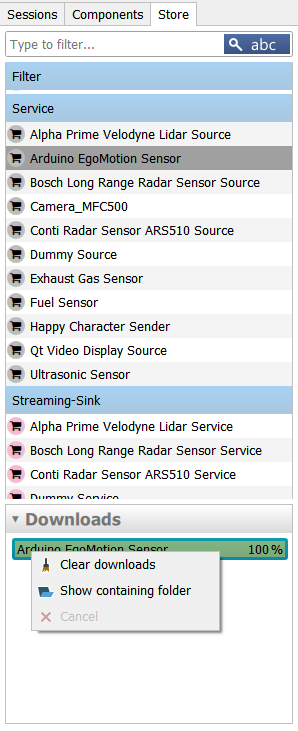
After a successful download the components are automatically loaded via the ADTF Environment Mechanism and are available in the Components view.
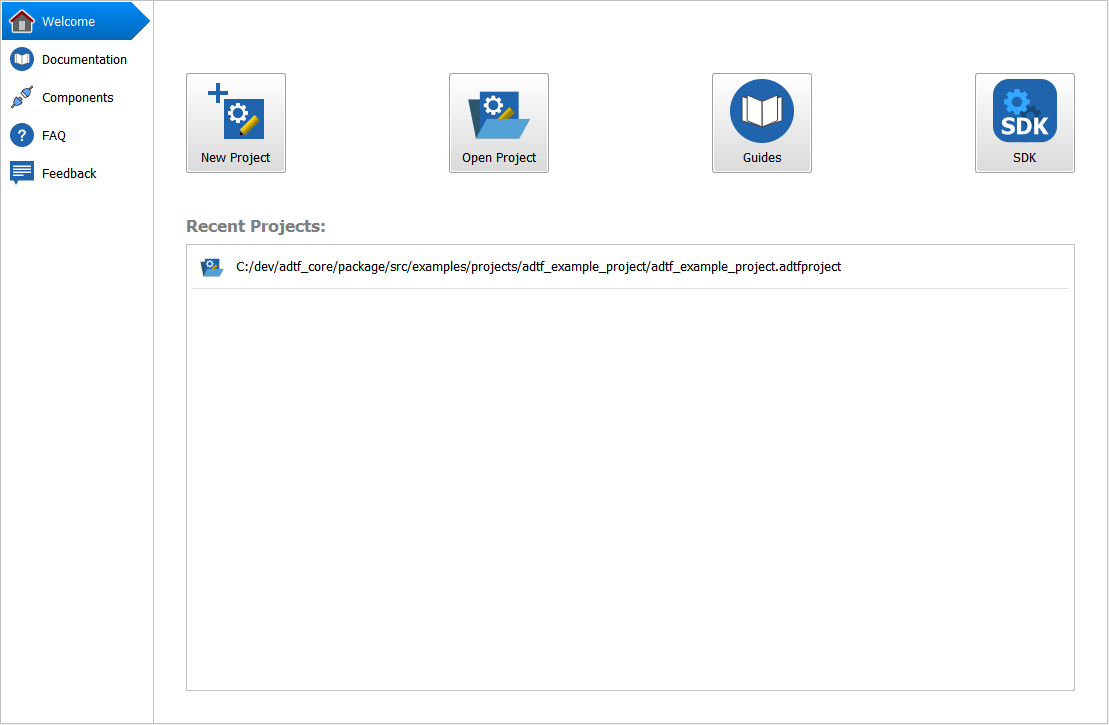
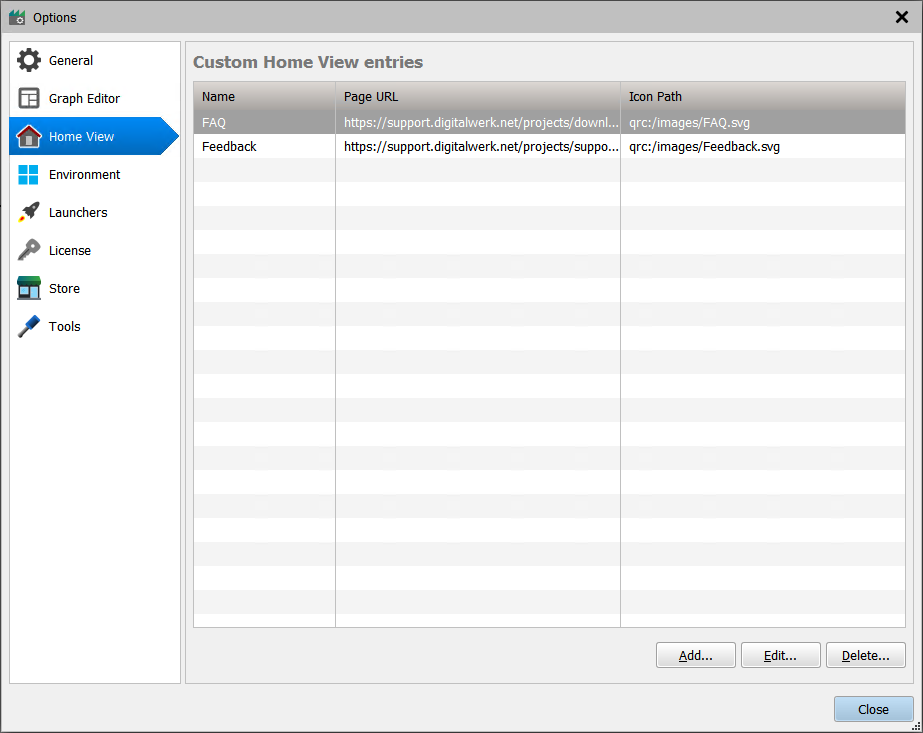
Home
This view is the main entry point for the CE.
The Home view is not only a landing page, it offers some quick actions to create or open projects and jump to documentation at the top.
The Left navigation bar provides some default actions linking to additional information which can be adapted and extended in your adtf_configuration_editor.cesettings file (see Tools > Options... > Home View)
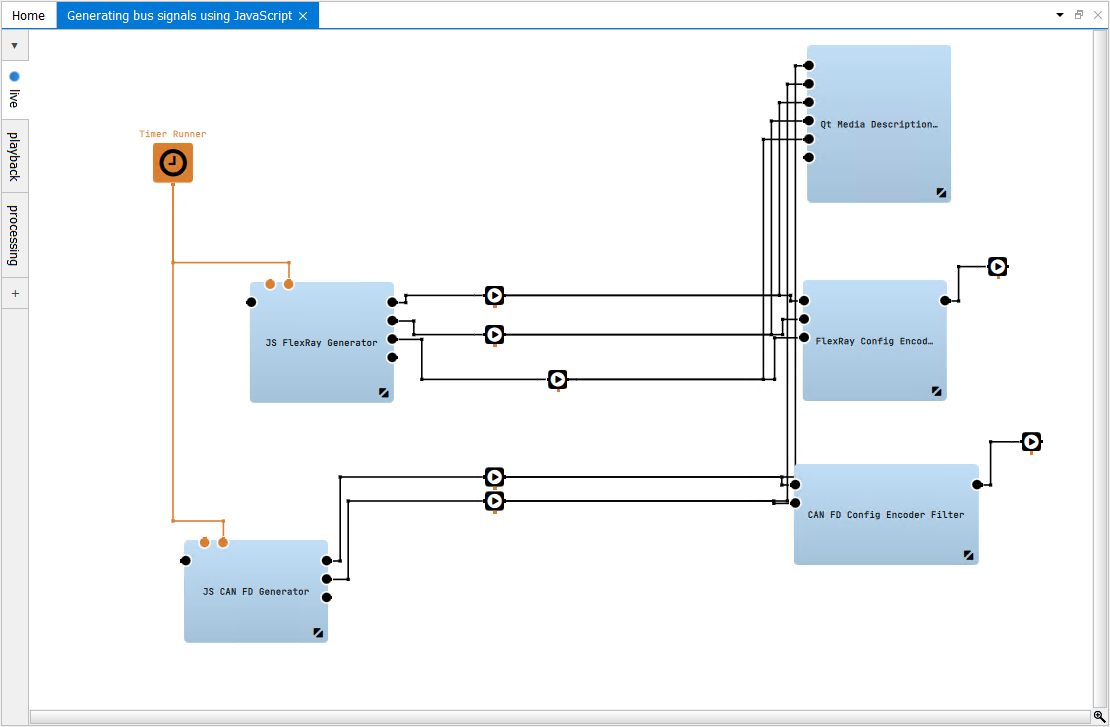
Filter Graph Editor
The filter graph is where all about data streaming and runtime behaviour takes place. You can use filters as well as streaming sources and sinks. We recommend to separate your graphs info different parts (e.g. data receiver/transmitter, playback, data processing, visualization, etc) by using subgraphs/included graphs. (link for more information about streaming architecture).
Basics
Processing can be triggered with the help of different types of Runners. By default triggers are sent between
the data samples and stimulate the following filter to do further processing, however if this behavior is not desired,
connections can be configured to be asynchronous. In this case Timer Runner can be used to take control over
the exact timing (this can be useful for expensive visual updates) or Thread Runner to do heavy processing on
a different thread. To let data flow between two elements place a Sample Stream between them and connect the
pins by drawing a line (will be added automatically during performing a pin-2-pin connection).
Appearance
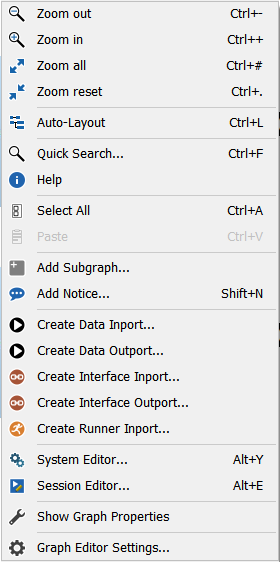
Graph files can contain several graphs, which can be nested together as subgraphs. For your orientation, each graph window represents one graph file and shows the session in the tab title on top. The tab bar on the left are the single graphs within the shown graph file.
Use right-click and context menu in any free space of the graph area for defining interfaces for in and out relations and, of course, some zoom and auto-layout functionality. Furthermore the context menu provides the option for adding an existing graph as subgraph (handled like a common filter), from the same graph file or a different session using ADTF Include Mechanism (see Session Editor). You can open and jump into these subgraphs and edit both side-by-side.
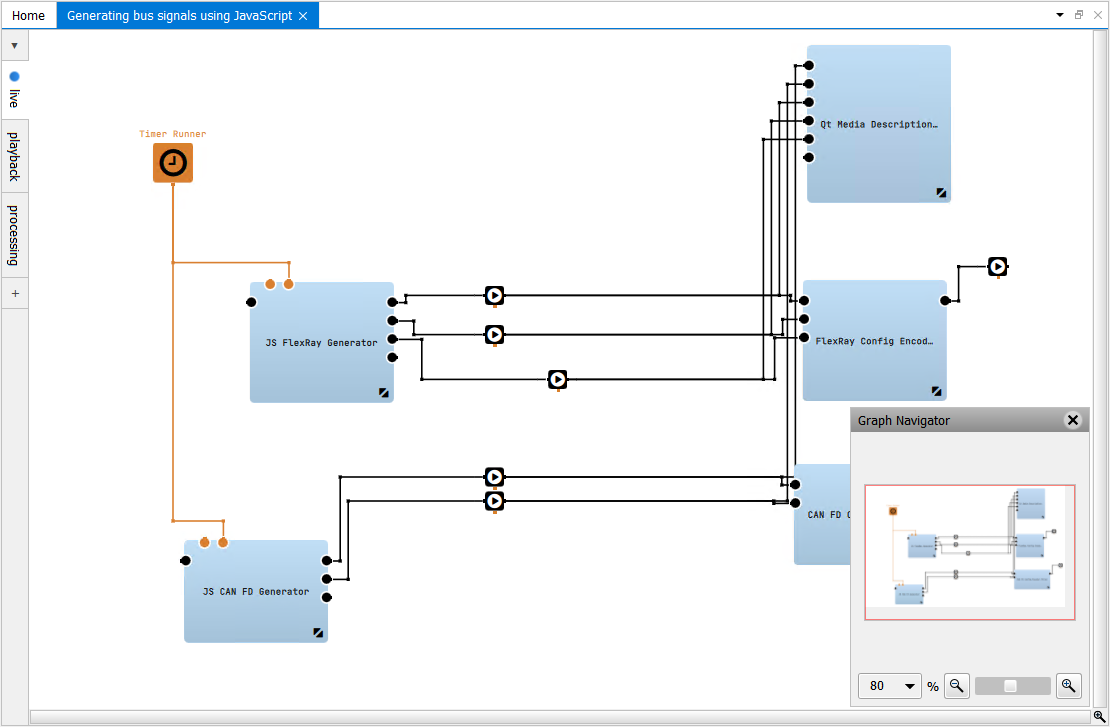
Graph Navigator
The Filter Graph Editor contains also a Graph Navigator at the bottom right of the graph area for convenience regarding scrolling, moving, zooming and item selection in larger graph setups (see section Available shortcuts). To show click on the icon on the bottom right, per default it will behided again when changing the scope. You can adjust these behavior under Tools > Options... > Graph Editor
Quick Search
Due to the fact that graphs should be seperated but can be as well very large, we offer a Quick search. This will help to find and jump to all containing components within the selected graph, which is very helpful especially for a Sample Stream or Binding Proxy which label name is hidden and only visible as tooltip for a better overview. It is available in the context menu anywhere in the Filter Graph Editor as well as a shortcut. It provides a dropdown menu including all containing graph components
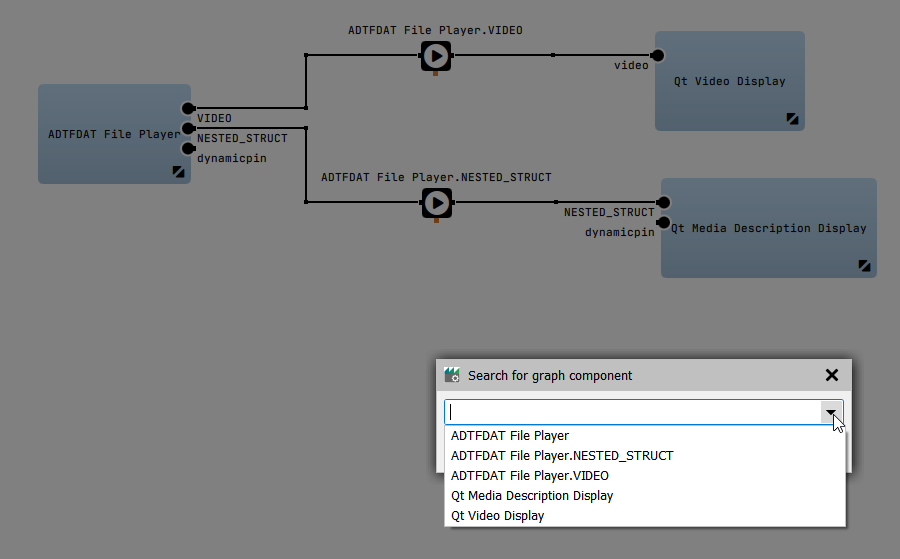
as well as an case sensitive auto completion in the type field. Use the arrow keys of the keyboard to complete the search strings or navigate through the component list:
Graph Labels
It is also possible to show or hide pin names of graph components. In case of hidden, the related content will only be visualized when selected or hovered by mouse. Furthermore, the Filter Graph Editor only marks recommended target pins during connection draw. Please keep in mind that the value of the property will be stored in the adtfuilayout of the adtfsession to guarantee your arrangement after loading the adtfsession. Keep also in mind the auto-layout will only cover visible content including pin names. Use this feature for compact behaviour. To enable/disable please navigate to View > Show Pin Names Permanently or use shortcut Ctrl + Space. Furthermore it is possible to show/hide sample stream names seperated (Toggle View > Show Sample Stream Names or use Shift + Space)
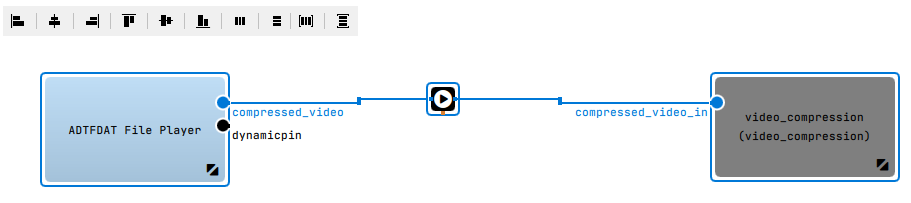
Align Helper
When you select more than one component within your graph, an align helper bar will appear in the upper left corner:
| Button | Change | Orientation | Keep |
|---|---|---|---|
| move all selected components to the left | farest left border of all selected components | vertical coordinates | |
| move all selected components to the center | horizontal center of all selected components | vertical coordinates | |
| move all selected components to the right | farest right border of all selected components | vertical coordinates | |
| move all selected components to the top | farest top border of all selected components | horizontal coordinates | |
| move all selected components to the center | vertical center of all selected components | horizontal coordinates | |
| move all selected components to the bottom | farest bottom border of all selected components | horizontal coordinates | |
| rearrange all selected components horizontally | user specified distance | vertical coordinates | |
| rearrange all selected components vertically | user specified distance | horizontal coordinates | |
| rearrange all selected components horizontally | calculated distance | vertical coordinates, outer horizontal borders | |
| rearrange all selected components vertically | calculated distance | horizontal coordinates, outer vertical borders |
Properties
If components from Components or the Filter Graph Editor provide some configuration options or additional information and help, it will be displayed within the Property Editor by selecting the component within its Graph / System Editor. It is also possible to jump properties from dependent services.
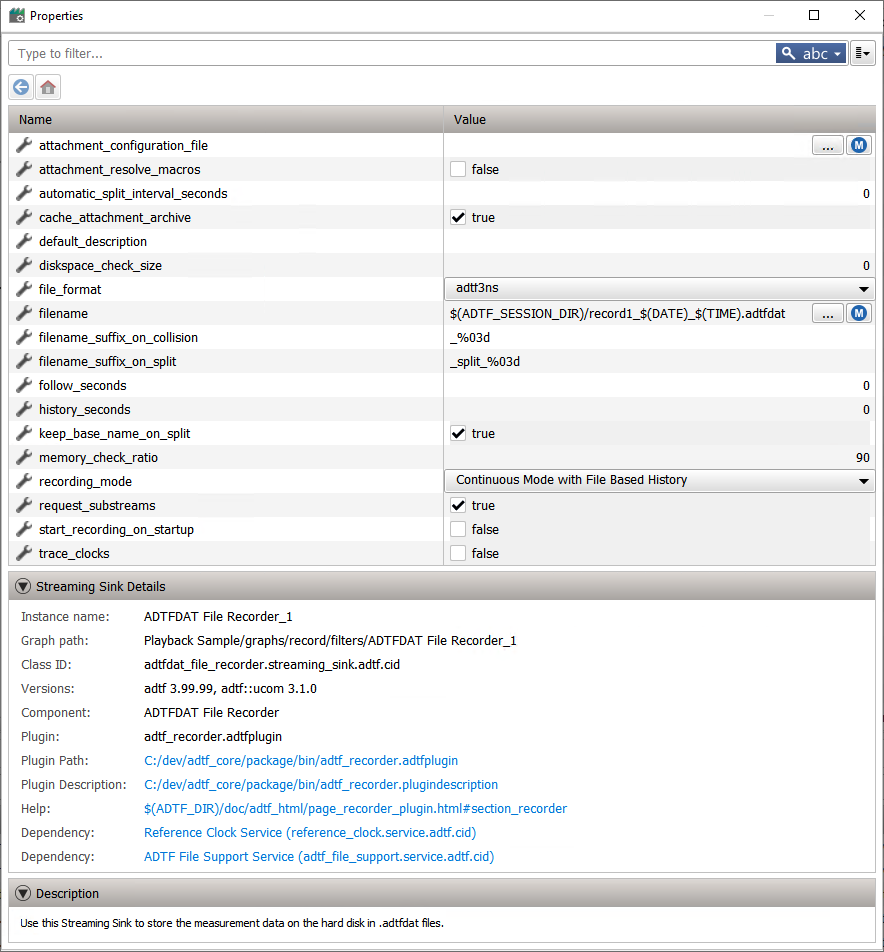
It is possible to add properties manually to each components and whole graphs. This is useful to create generic graphs, which can be included as configurable subgraphs. Furthermore you can link properties of components to graph properties to make them available to set from "outside" (parent graph). Please also have a look at Use and link graph properties for more information.
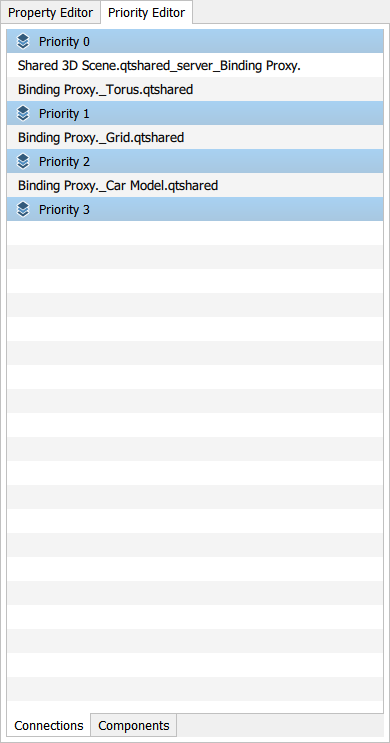
Priorities
This view is to show and edit the priority of connections and components. For an explanation what happens during (de)initialization please have a detailed look at Session Initialization .
Validation Protocol
All session, graph, system, property or setting related problems spotted by the CE are displayed here.
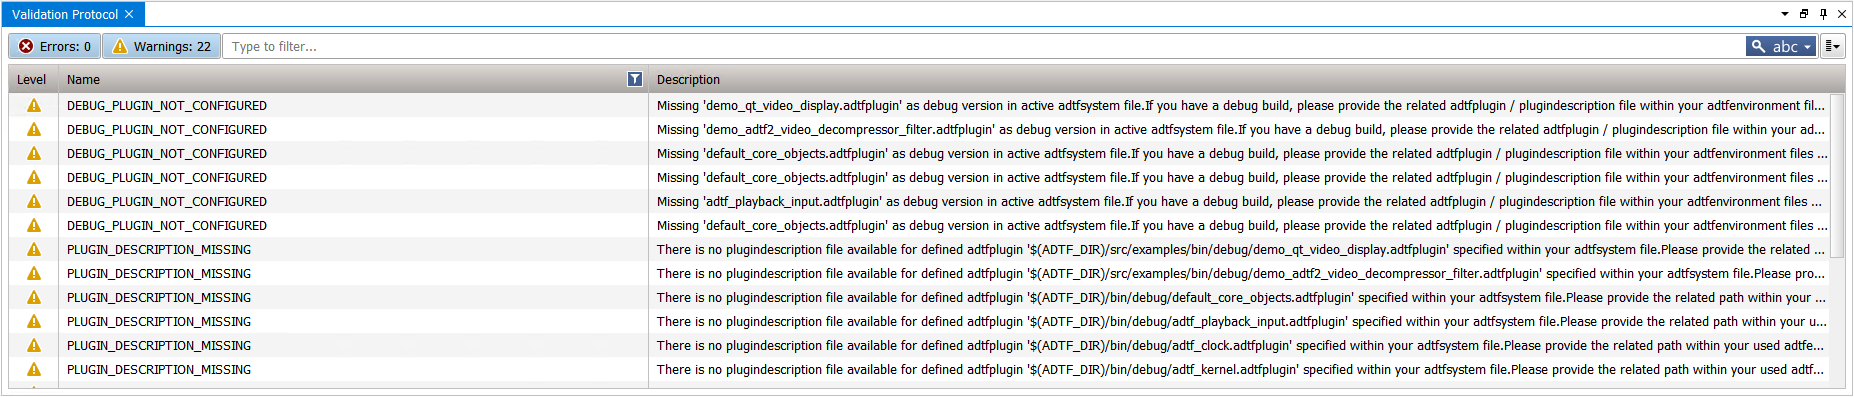
The get further information or help to solve the the entry, please consider the context menu for details:
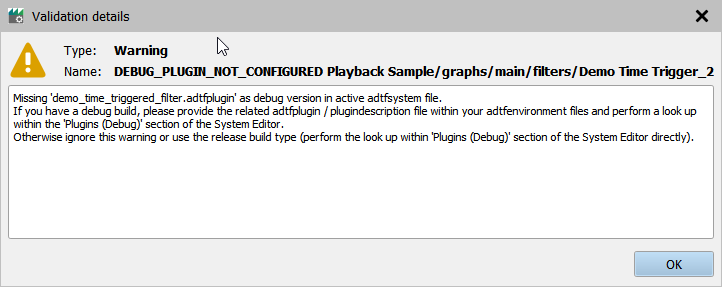
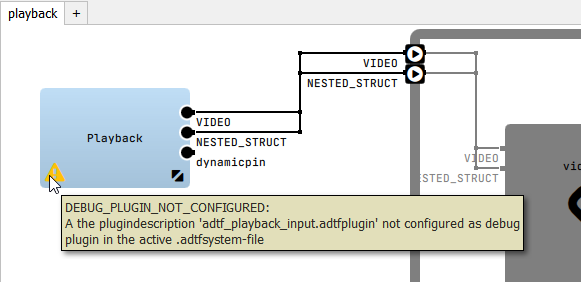
If the problem is related to a specific graph component, it will be also marked within the Filter Graph Editor including a tooltip.
CE Log
Within this view, you can redirect the console output
including also JavaScript / QML occur within the CE:
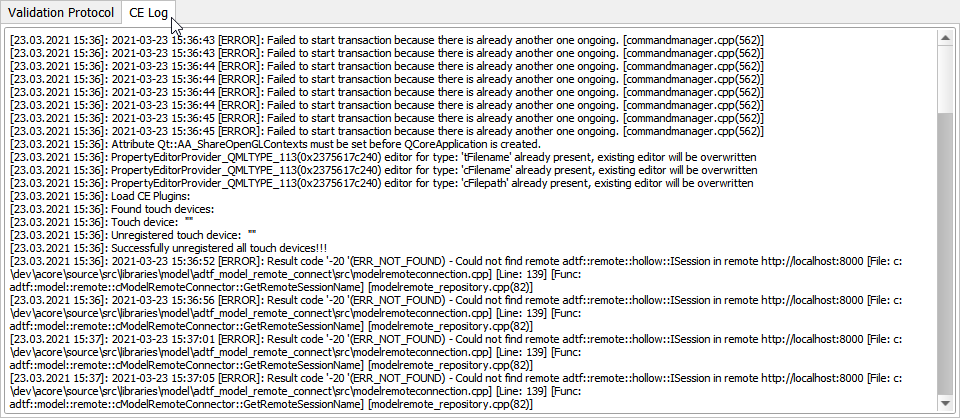
This can be different loglevels from the CE itself, but also come along inside custom Qml Filter Editor scripts.
You can also have a look at $(ADTF)/bin/adtf_playback_input_filtereditor.qml which will be used to create pins from the .adtfdat within the
ADTFDAT File Player. Other examples can be found as well at $(ADTF_DIR)/bin/*.qml.
You can enable/disable the logging persistent within Tools > Options... > General or temporary by starting the CE with flag --enable-logging.
Options
Here you can define custom settings for the CE.
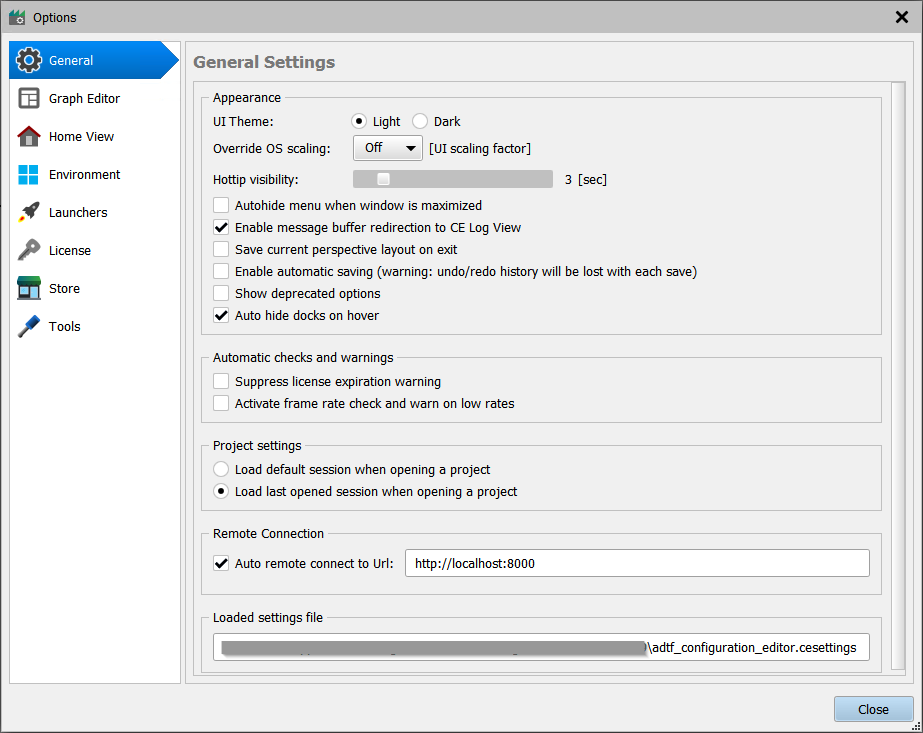
General
This section is to adapt basic appearance and behavior.
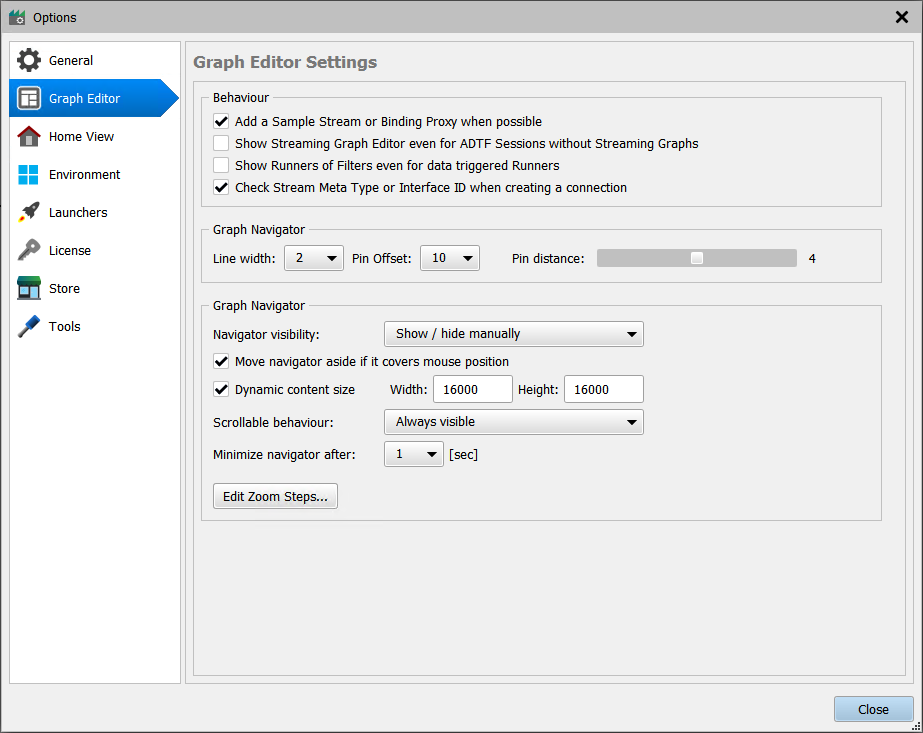
Graph Editor
This section handles behavior within Filter Graph Editor and its Graph Navigator.
Home View
This section is your possibility to enhance the landing page with useful shortcuts for your daily work.
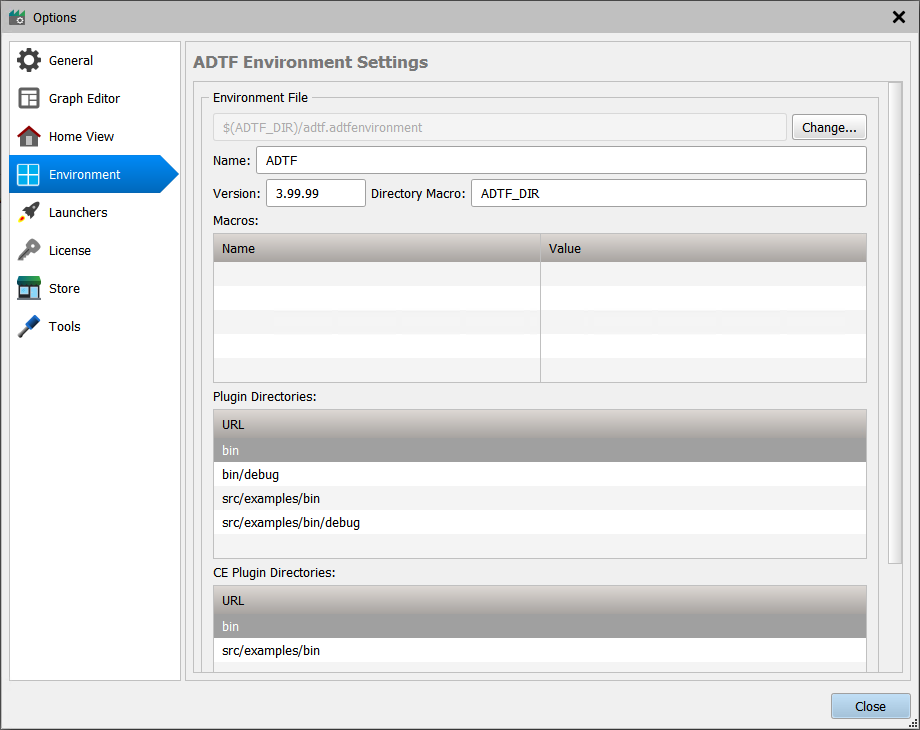
Environment
This section shows each relation and included loaded package.
Launchers
This section defines additional shortcuts and to launch sessions.
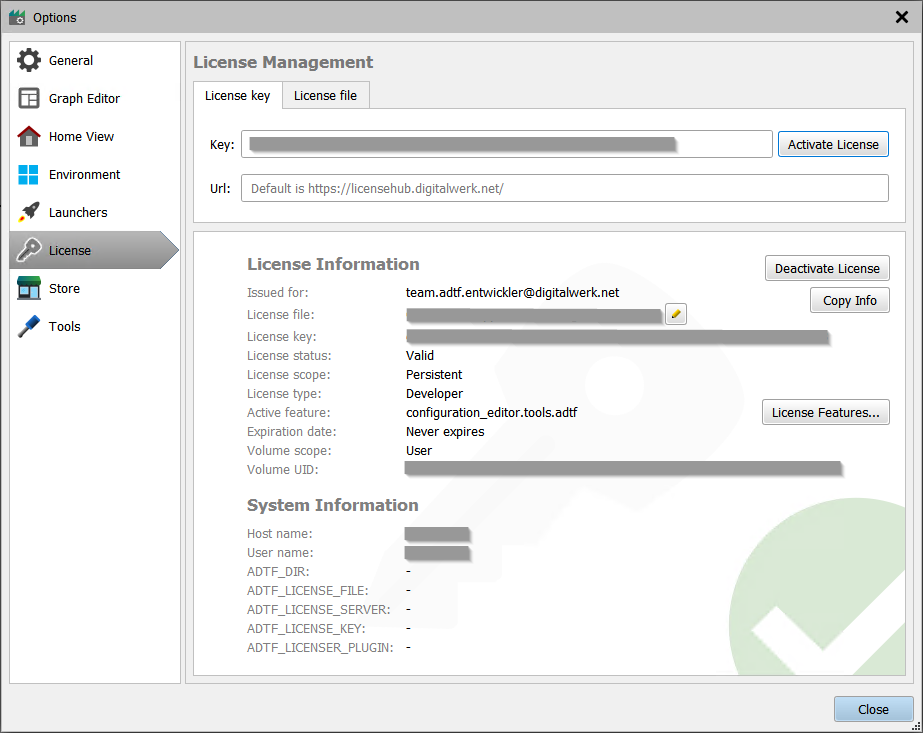
License
This section handles the entire license management for ADTF Tools and Plugins.
Remote Connections
This sections manages URLs for remote connection and options to disabling RPC & friends.
Store
This section handles all the settings neccessary to use the CE
as client for one or more component stores. At least one store endpoint consisting of an URL and access token
must be defined in order to use this feature. If you wish to download adtfplugins as well be sure to set the download location.
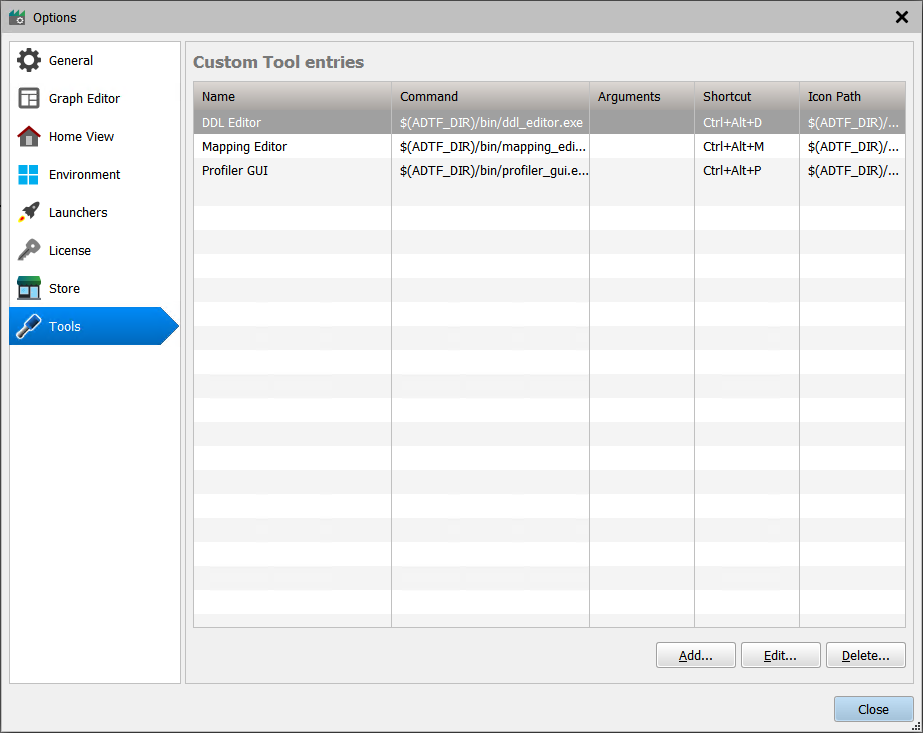
Tools
This section is the place to add shortcuts for additional tools which can be executed from CE.
Available shortcuts
adtf_configuration_editor.cesettings), the variable shortcuts may differ.
Common
| Shortcut | Action |
|---|---|
| Ctrl + N | Create project |
| Ctrl + O | Open project |
| Ctrl + S | Save project |
| Ctrl + W | Close project |
| Ctrl + Q | Exit application |
| Ctrl + Z | Undo |
| Ctrl + Y | Redo |
| Alt + O | Open Options |
| Ctrl + F1 | Open documentation of ADTF Configuration Editor |
| Shift + F1 | Show About Dialog |
Projects and Sessions
| Shortcut | Action |
|---|---|
| Ctrl + Shift + N | Add new session to project |
| Ctrl + Shift + O | Open selected session |
| F2 | Rename selected session |
| Del | Remove selected session |
| F5 | Launch selected session with ADTF Launcher |
| Ctrl + F5 | Launch selected session with ADTF Launcher (using debug binaries) |
| Shift + F5 | Launch selected session with ADTF Launcher (enabled profiling) |
| F6 | Launch selected session with ADTF Control |
| Ctrl + F6 | Launch selected session with ADTF Control (using debug ADTF Launcher and binaries) |
| Shift + F6 | Launch selected session with ADTF Control (enabled profiling) |
| F7 | Launch selected session with ADTF GUI Control |
| Ctrl + F7 | Launch selected session with ADTF GUI Control (using debug ADTF Launcher and binaries) |
| F8 | Launch selected session with FEP-Selfmanaged Launcher |
| Ctrl + F8 | Launch selected session with FEP-Selfmanaged Launcher (using debug binaries) |
| F9 | Launch selected session with FEP Launcher |
| Ctrl + F9 | Launch selected session with FEP Launcher (using debug binaries) |
| Ctrl + Shift + E | Enable remote connection for selected session |
| Ctrl + Shift + L | Launch selected session (remote connection will be enabled) |
| Alt + Y | Open System Editor |
| Alt + E | Open Session Editor |
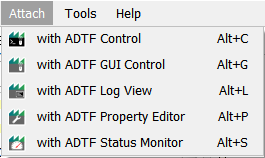
Attach
| Shortcut | Action |
|---|---|
| Alt + C | Attach with ADTF Control |
| Alt + G | Attach with ADTF GUI Control |
| Alt + L | Attach with ADTF Log View |
| Alt + P | Attach with ADTF Property Editor |
| Alt + S | Attach with ADTF Status Monitor |
System Editor
| Shortcut | Action |
|---|---|
| Ins | Add element |
| F1 | Show help for selected service (if specified in corresponding Plugin Description) |
| F2 | Edit / Rename selected element |
| Del | Remove selected element |
| Ctrl + Del | Remove all elements or platform |
| Shift + Up | Move selected service up within current Runlevel |
| Shift + Down | Move selected service down within current Runlevel |
| Shift + 1 | Set RL_System for selected service |
| Shift + 2 | Set RL_Session for selected service |
| Shift + 3 | Set RL_StreamingGraph for selected service |
| Shift + 4 | Set RL_FilterGraph for selected service |
| Shift + 5 | Set RL_Running for selected service |
Filter Graph Editor
| Shortcut | Action |
|---|---|
| Ctrl + Space | Show pin names of graph components permanently or only when focused/selected |
| Shift + Space | Hide/show label names of sample streams |
| Ctrl + Tab | Navigate through graph tabs |
| Ctrl + Shift + Tab | Navigate through graph tabs (reverse) |
| Ctrl + Left-Click | Multi select components |
| F1 | Show help for selected component (if specified in corresponding Plugin Description) |
| F2 | Rename selected graph element |
| Del | Remove selected graph element(s) |
| Shift + N | Add notice |
| Ctrl + A | Select all graph elements |
| Ctrl + F | Quick search |
| Ctrl + X | Cut selected graph elements to clipboard |
| Ctrl + C | Copy selected graph elements to clipboard |
| Ctrl + V | Paste graph elements from clipboard |
| Ctrl + L | Auto-Layout |
| Ctrl + - | Zoom out |
| Ctrl + + | Zoom in |
| Ctrl + # | Zoom all |
| Ctrl + . | Zoom reset |
| Shift + Left-click (and hold) | Move graph area |
| Mouse-wheel | Scroll vertically |
| Shift + Mouse-wheel | Scroll vertically (x10) |
| Alt + Mouse-wheel | Scroll horizontally |
| Alt + Shift + Mouse-wheel | Scroll horizontally (x10) |
| Ctrl + Mouse-wheel | Zoom |
| Ctrl + Shift + Mouse-wheel | Zoom (x10) |
| Ctrl + Shift + C | Copy name of selected component |
| Ctrl + Shift + P | Copy path within graph of selected component |
| Alt + Y | Open System Editor |
| Alt + E | Open Session Editor |
| Alt + Click | Show Properties for selected component/graph |
Graph Navigator
| Shortcut | Action |
|---|---|
| Left-Click (and hold) | Move red view section |
| Shift + Left-Click | Select components |
| Ctrl + Shift + Left-Click | Multi select components |
| Shift + Left-Click (and hold) | Move selected components |
Properties
| Shortcut | Action |
|---|---|
| F2 | Rename selected property |
| Ctrl + X | Cut selected property to clipboard |
| Ctrl + C | Copy selected property to clipboard |
| Ctrl + V | Paste property from clipboard |
| Ins | Create new property |
| Del | Remove selected property |
Priorities
| Shortcut | Action |
|---|---|
| Shift + Up | Decrement priority |
| Shift + Down | Increment priority |
Validation Protocol
| Shortcut | Action |
|---|---|
| Alt + D | Show further details for entry |
CE Log
| Shortcut | Action |
|---|---|
| Ctrl + A | Select all messages |
| Ctrl + C | Copy selected text |
| Del | Clear window |
Tools
| Shortcut | Action |
|---|---|
| Alt + Y | Open System Editor |
| Alt + E | Open Session Editor |
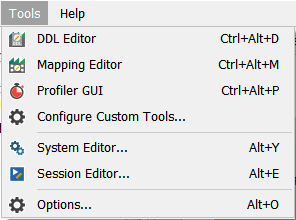
| Ctrl + Alt + D | Start DDL Editor |
| Ctrl + Alt + M | Start Mapping Editor |
| Ctrl + Alt + P | Start Profiler GUI |
Where to go next?
Have a look at the ADTF Launcher guide to learn about the central command line tool for executing sessions.